Polymorphism in R Programming (original) (raw)
R language implements parametric polymorphism, which means that methods in R refer to functions, not classes. Parametric polymorphism primarily lets us define a generic method or function for types of objects we haven’t yet defined and may never do. This means that one can use the same name for several functions with different sets of arguments and from various classes.
Generic Functions
Polymorphism in R can be obtained by the generics. It allows certain names to be treated as methods and they act as dispatchers. Dispatchers help R decide which function to use depending on the type of input.
Let's understand with the help of plot function and summary function. In R programming , the plot() and summary() functions return different results depending on the objects being passed to them and that's why they are generic functions that implement polymorphism.
1. plot() in R
plot() is one of the generic functions that implement polymorphism in R. It produces a different graph depending upon its input (vector, factor, data frame, etc). Let's see the code for the plot function.
R `
plot
`
**Output:
function (x, y, ...)
UseMethod("plot")
We can see that , the body of the plot function contains only one expression and that is UseMethod("plot"). Let's see the definition of UseMethod using help() function.
R `
help(UseMethod)
`
**Output:
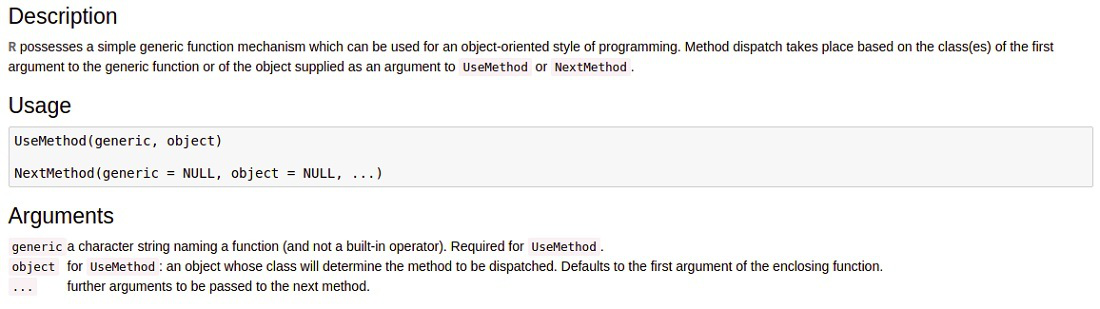
From the above output, we can see that UseMethod takes two parameters generic and object.
- The generic is the string name, which is the name of the function (plot in this case).
- This is an object whose class will determine the method that will be “dispatched". This means the object’s class decides which version of the function will be used.
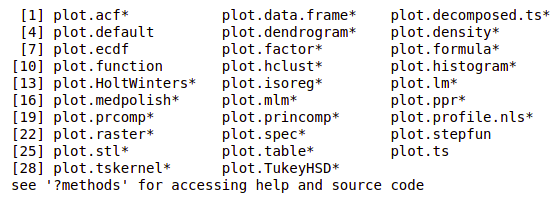
The UseMethod then searches for the suitable plot function that is needed to be called by creating a string of the type plot.object. We can also see all the available methods for the plot function.
R `
methods(plot)
`
**Output:
Let's see how plot() function taking arguments and displaying different outputs.
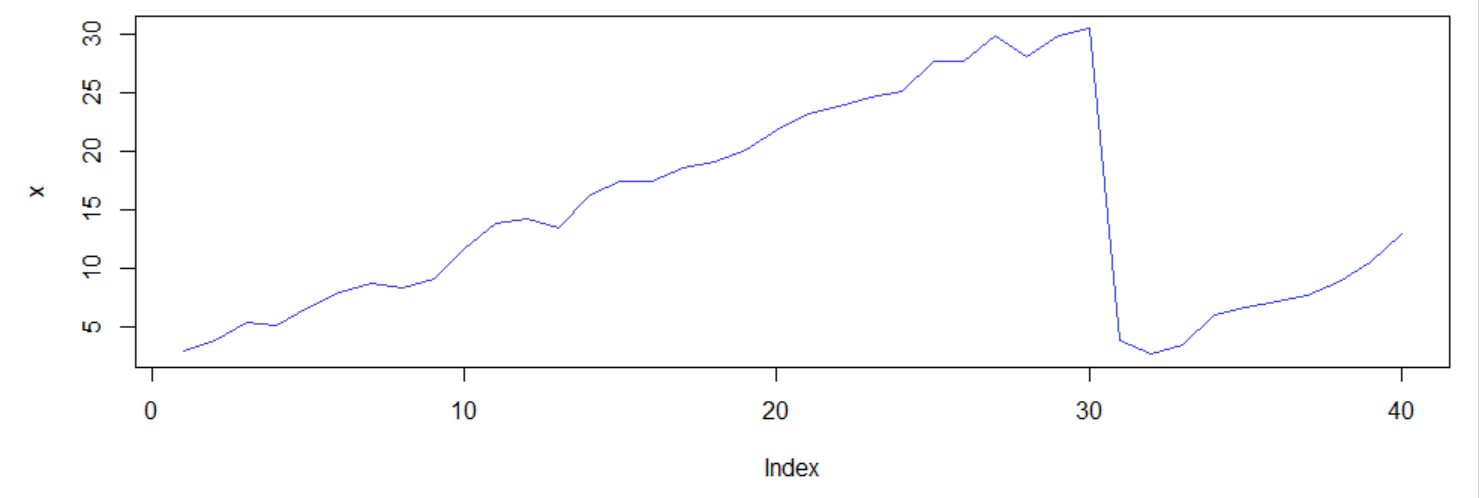
1.1 Input as a numeric vector
In this example let's take a single numeric vector inside plot() function as a parameter.
R `
X Window System Graphics (X11)
X11(width = 15, height = 13)
x <- 3 * runif(40) + (1:30)
par(mar = c(20, 20, 1, 1)) plot(x, type = 'l', col = '#343deb')
z <- locator(1)
`
**Output:
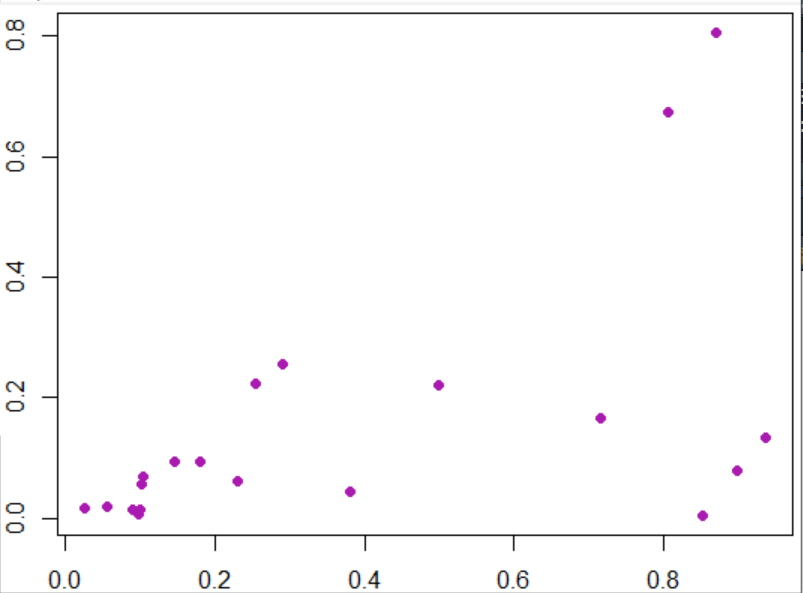
1.2 Inputs as two numeric vectors
We need to pass two vector parameters and it produces a scatter plot accordingly.
R `
X11(width = 5, height = 3)
x <- runif(20) y <- runif(20) * x par(mar = c(2, 2, 0.3, 0.3))
plot(x, y, type = 'p', pch = 16, col = '#ab1ab0')
z <- locator(1)
`
**Output:
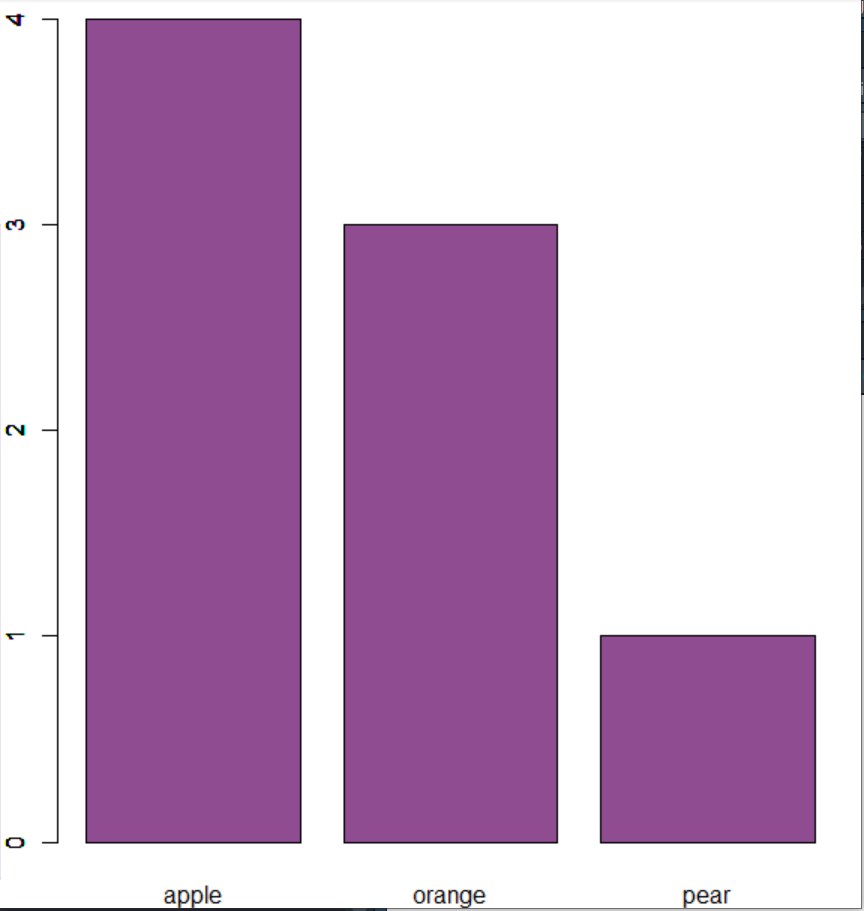
1.3 Input as factor
If we passed factor as arguments then we get a bar chart pattern.
R `
X11(width = 5, height = 8)
f <- factor(c('apple', 'orange', 'apple', 'pear', 'orange', 'apple', 'apple', 'orange'))
par(mar = c(2, 2, 0.6, 0.6))
plot(f, col = '#8f4c91') z <- locator(1)
`
**Output:
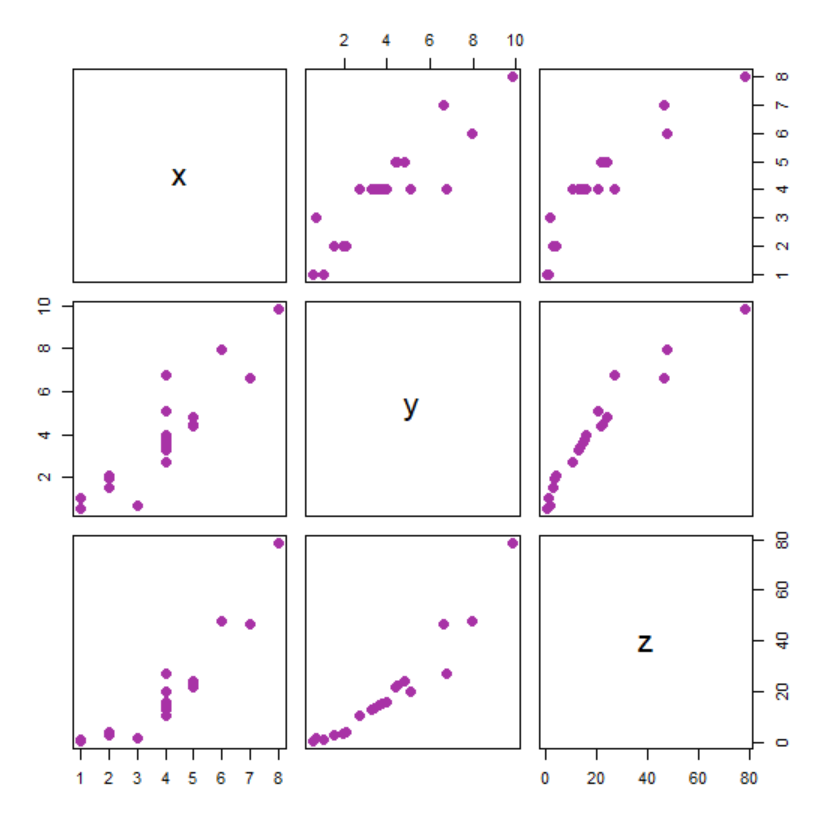
1.4 Input as data frame
The Plot function takes the data frame as an argument and each variable of the data frame is plotted against each other.
R `
X11(width = 6, height = 6)
set.seed(280870) x <- c(4, 3, 1, 2, 2, 4, 6, 4, 5, 5, 4, 4, 5, 4, 4, 8, 4, 1, 2, 7) y <- x * rnorm(20, 1, 0.3) z <- x * y
df <- data.frame(x, y, z) par(mar = c(0.1, 0.1, 0.1, 0.1))
plot(df, col = '#a832a6', pch = 16, cex = 1.5) z <- locator(1)
`
**Output:
2. summary() in R
summary() is also a generic function that implements polymorphism in R. It is used to produce summaries of the results of various model fitting functions.
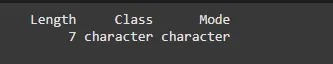
Example 1
R `
colors <- c("violet", "indigo", "blue", "green", "yellow", "orange", "red") summary(colors)
`
Output:
Example 1
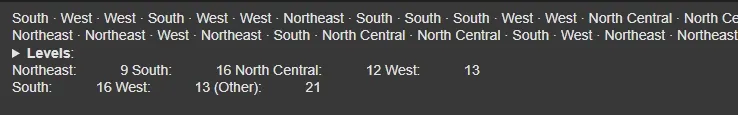
Example 2
Let us check for summarized results for state.region. In R it usually displays what regions are available under "Northeast", "South", "North Central" and "West". Using summary() function, either one can pass state.region as 1st parameter and as a second step, (optionally) pass "maxsum" argument. "maxsum" indicates how many levels should be shown for factors in output.
R `
state.region summary(state.region) summary(state.region, maxsum = 3)
`
**Output:
Example 2:
Example 3
Let's have a look on how the summary() function works if the data set is very large .
R `
x <- stats::rnorm(10) x
c <- cut(x, breaks = -3:3) c
summary(c)
`
**Output:
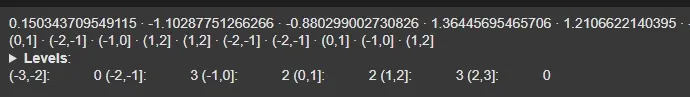
Example 3:
3. Creating a Custom Generic Method
Now let's create our own generic methods.
1. Defining the Generic Function
We start by defining a generic process() function that will dynamically call the appropriate method based on the type of input:
R `
process <- function(obj) { UseMethod("process") }
`
2. Defining Methods for Different Data Types
Next, we define specific methods for different data types. Each method will handle a different class of input.
**2.1 Method for Numeric Input
For numeric inputs, the method returns the square of the number.
R `
process.numeric <- function(obj) { cat("The square of", obj, "is", obj^2, "\n") }
`
**2.2 Method for Character Input
For strings, the method reverses the string and prints it.
R `
process.character <- function(obj) { cat("The reverse of the string is:", paste(rev(strsplit(obj, NULL)[[1]]), collapse = ""), "\n") }
`
**2.3 Method for List Input (Objects)
For lists acting as objects, this method prints the details of the object.
R `
process.list <- function(obj) { if ("name" %in% names(obj)) { cat("Object name: ", obj$name, "\n") } if ("account_no" %in% names(obj)) { cat("Account number: ", obj$account_no, "\n") } cat("Other details:", paste(names(obj), ":", unlist(obj), collapse = ", "), "\n") }
`
**2.4 Method for Bank Class (Custom Object)
For objects of class bank, this method prints specific banking details like the account holder's name, account number, savings and withdrawal amounts.
R `
process.bank <- function(obj) { cat("Bank Object Details:\n") cat("Account Holder: ", obj$name, "\n") cat("Account Number: ", obj$account_no, "\n") cat("Saving Amount: ", obj$saving, "\n") cat("Withdrawn Amount: ", obj$withdrawn, "\n") }
`
3. Creating Example Objects and Calling the process() Function
**3.1 Numeric Input Example
We create a numeric input and use process() to calculate its square.
R `
num_input <- 10 process(num_input)
`
**Output:
The square of 10 is 100
**3.2 String Input Example
We create a string input and use process() to reverse the string.
R `
str_input <- "Hello" process(str_input)
`
**Output:
The reverse of the string is: olleH
**3.3 List Acting as a Bank Object Example
We create a bank object using a list, assign the bank class to it and call process() to display its details.
R `
bank_obj <- list(name = "Arjun", account_no = 1234, saving = 1500, withdrawn = 234) class(bank_obj) <- "bank" process(bank_obj)
`
**Output:
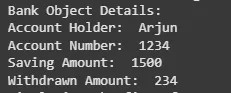
Object Example
**3.4 Data Frame Example
We create a data frame and call process() to display the first few rows.
R `
df_input <- data.frame(Name = c("Alice", "Bob", "Charlie"), Age = c(25, 30, 35)) process(df_input)
`
**Output:
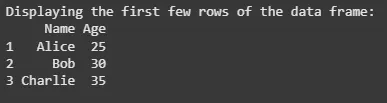
Data Frame Example
This approach demonstrates polymorphism in R using method dispatch. The process() function adapts its behavior based on the input type and we've defined specific methods for numeric, string, list (custom object) and data frame inputs. This technique allows you to handle different data types in a flexible and dynamic way, making your code more modular and scalable.
In this article, we explored how R supports polymorphism through generic functions like plot() and summary() and demonstrated how to create custom generic methods using UseMethod() by building a simple Bank class.