Creating measures using DAX (original) (raw)
Last Updated : 8 Apr, 2026
DAX (Data Analysis Expressions) measures in Power BI are dynamic calculations used to aggregate, filter and analyze data based on context. They can perform simple aggregations as well as complex calculations using user-defined formulas
**Syntax of DAX Measures:
MeasureName = FunctionName(TableName[ColumnName])
Alternatively for more complex expressions:
MeasureName = FunctionName(TableName[Column1], Expression, TableName[Column2])
**Parameters:
- **MeasureName: Name of the DAX measure we're creating.
- ****'=':** Shows the start of the formula.
- **FunctionName: The DAX function you are using (e.g., SUM, MAX, etc.).
- **Parentheses ( ): Enclose the arguments or columns used in the function.
- **Table and Column References: Specify the table and column being used in the function, along with any scalar operators like +, -, *, /
Understanding Measure
A measure is a dynamic calculation performed on data fields that can include arithmetic operations or aggregation functions. In Power BI, measuresare created using DAX functions like SUM, AVERAGE, MAX, MIN and COUNT. It help in summarizing data and generating insights based on user-defined criteria.
**Examples of Measures: Total Sales, Total Salaries, Average Quantity, Average Order Value, Count of Customers, Year-to-Date (YTD) Sales, etc.
1. Creating Measure Table
A Measure Table in Power BI is a special table used to store all the DAX measures created in our report. It helps organize measures for better management and clarity in our data model. To create a new Measure Table in Power BI:
- In Model View click the "Create New Table" button from the menu bar.
- Provide a name for the table.
- Click the "Load" button to create the new table.
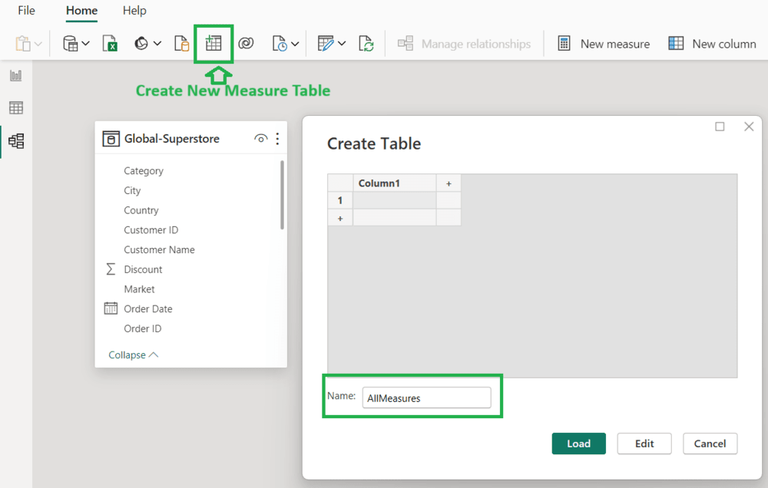
DAX Measure Table in Power BI
2. Create New Measure from Measure Table
We can easily create new measures and add them to our Measure Table in Power BI. To create a new measure:
- Right-click on the Measure Table in the Fields pane.
- Select "New Measure" from the context menu.
- In the formula bar, enter the DAX formula for our new measure.

Create Measures from Measure Table
3. Creating a DAX Measure
1. Open Power BI Desktop
2. Import Data from a Data Source like Excel, SQL Server, Access, Oracle, MySQL or any other data set like XML, JSON, Text File

Get Data Source
3. Once the data source is loaded, the Fields list will be added to the right of the window.

Data Fields in Power BI design window
4. Create a New DAX Measure by clicking the 'New Measures' button at the tool bar at the top.

Add New Measure
5. Input New Measure Name and default will be 'Measure' and add '**=' sign

Details of creating a New Measure
6. Add Function Name like Sum, Average, MAX, MIN or any other calculation function and open a bracket '('.
7. Select the Column name from the list of columns after typing in the table name and close the bracket ')'
8. The new measure is ready. The new measure will be displayed with the fields list.

New Measure added to fields list.
9. Use the Measure to create Visualization in Power BI as below.

DAX Measure used in Power BI Visualization
Creating Measures Using AggregateX Functions
AggregateX functions are used to perform row-wise calculations over a table or table expression. These functions aggregate values based on expressions evaluated for each row. These are some of the commonly used AggregateX function: SUMX, AVERAGEX, COUNTX, MINX and MAXX
**Syntax:
AggregateX(Table, Expression)
- **Table: Table or table expression to evaluate.
- **Expression: Calculation or expression to calculate for each row of the table.
**Example:
AggregateX Demo = SUMX('Global-Superstore','Global-Superstore'[Shipping Cost] - 'Global-Superstore'[Sales])
Common Aggregate DAX Functions
| Function Name | Description |
|---|---|
| AVERAGE | Returns the average (arithmetic mean) of the numbers in a column. |
| AVERAGEA | Returns the average of values including logical and text values. |
| AVERAGEX | Calculates the average of expressions evaluated over a table. |
| COUNT | Counts numeric values in a column. |
| COUNTA | Counts non-blank rows in a column. |
| COUNTX | Counts rows with numeric values or expressions that evaluate to numbers. |
| COUNTBLANK | Counts the number of blank cells in a column. |
| COUNTROWS | Counts the total number of rows in a table. |
| DISTINCTCOUNT | Counts the number of distinct values in a column. |
| MAX | Returns the largest numeric value in a column or between two expressions. |
| MAXA | Returns the largest value in a column including logical values and text. |
| MAXX | Returns the largest value from an expression evaluated for each row in a table. |
| MIN | Returns the smallest numeric value in a column or between two expressions. |
| MINA | Returns the smallest value including logical values and numbers as text. |
| MINX | Returns the smallest value from an expression evaluated for each row. |
| SUM | Adds all numeric values in a column. |
| SUMX | Sums an expression evaluated for each row in a table. |
AggregateX Functions as Iterator Functions
AggregateX functions like SUMX, AVERAGEX, COUNTX, MINX and MAXX are known as iterator functions. These functions are useful when we need to perform calculations across rows of a table involving columns from different related tables. An iterator function calculates the given expression for each row of the table specified. This allows us to perform row-wise operations and aggregate the results.
**Example: Consider an example where we want to calculate the sum of cookies shipped but only for values above 800:
SumOfCookiesabove800 =
SUMX(
'Order Data',
IF('Order Data'[Cookies Shipped] > 800,'Order Data'[Cookies Shipped],0))
In this example, SUMX iterates over each row in the Order Data table and for each row, it checks if the value of Cookies Shipped is greater than 800. If it is, it adds the value to the total sum otherwise it adds 0. This allows us to sum only the rows that meet the specified condition.

Creating Calculated Columns Using DAX
Calculated columns are new columns created in an existing data table using a DAX formula. Once created these columns become part of the table and can be used in Power BI visualizations like any other field. To create a new calculated column in Power BI:
- Select the table where you want to add the calculated column.
- Click the "New Column" button in the toolbar.
- In the DAX formula bar enter the DAX formula to define the calculation for the new column.

Calculated Column
DAX CALCULATE and VALUES Functions
1. CALCULATE Function
The CALCULATE function in Power BI is one of the most fundamental DAX functions. It is used to find an expression with the application of filters or conditions which allows us to change the context in which the calculation is performed.
**Syntax:
CALCULATE(Expression, [Filter1], [Filter2], ...)
- **Expression: Calculation or measure we want to find.
- **Filter1, Filter2, ...: Optional filter conditions that modify the context of the calculation.
**Example: To calculate the total sales for a specific country, we can use the CALCULATE function:
SalesUSA = CALCULATE(SUM('Sales'[Revenue]), 'Sales'[Country] = "USA")
This formula calculates the sum of the Revenue column but only for the rows where the Country is "USA".

CALCULATE function
2. VALUES Function
The VALUES function in DAX is used to retrieve distinct values from a column or table. This can be useful when we need to work with unique values for calculations.
**Syntax:
VALUES(TableORColumnName)
**Example: To count the number of distinct cities:
Number of Cities = COUNTROWS(VALUES(City[CityName]))
Using the FILTER Function in DAX
The FILTER function in DAX is used to return a filtered table based on specified conditions. It is used in combination with other functions like CALCULATE
**Syntax:
FILTER(Table, FilterCondition)
**Example: To calculate the sum of Forecast for the countries "USA" and "Italy":
FilterDAX1 = Calculate(SUM(Forecast[Forecast]),FILTER(Forecast, Forecast[Country]="USA" || Forecast[Country]="Italy"))
Variable for Debugging
Variables in DAX are used to store intermediate values and reuse them within the same formula. Using variables can make our formulas more readable and maintainable.
Below is the Syntax of how a variable is used:
VAR variable_name = expression
RETURN result_expression
- **VAR: Declares a variable.
- **RETURN: Defines the expression that will return the result.
**Example: Calculating the discount offered based on the quantity of cookies shipped:
DiscountOffered = VAR SaleQuantity = SUM('Order Data'[Cookies Shipped])
VAR CostOfCookies=SUM('Order Data'[Cost])
Return IF(SaleQuantity > 800, CostOfCookies * 10/100, SaleQuantity * 5 / 100)
In this example, two variables are created: SaleQuantity and CostOfCookies. The discount is calculated based on the number of cookies shipped which helps in applying different rates for quantities above or below 800.
**Output:

DAX Studio
DAX Studio is a tool to write, execute and analyze DAX queries in Power BI. It provides a range of features that help developers create, test and optimize DAX formulas. It integrates seamlessly with Power BI which allows direct connections to Power BI models and datasets.
With DAX Studio, we can:
- Write complex DAX queries in the Query Editor.
- Execute the queries and view results immediately.
- Optimize your DAX formulas for better performance.
**Writing Queries in DAX Studio
To write a query or calculation in DAX Studio, the query typically starts with the EVALUATE keyword as shown in the example below:
EVALUATE
SUM('Order Data'[Cost])
This query calculates the total cost from the Order Data table.
Example of Using DAX Studio Editor:
