Power BI Drill through Filters (original) (raw)
Last Updated : 19 Jan, 2026
Drill-through filters in Power BI allow users to navigate from a summary visual to a detailed report page focused on a specific entity such as a customer, supplier or product. With a simple right-click on a data point report readers can explore deeper insights that are automatically filtered for the selected context. This feature makes reports more interactive, intuitive and analysis-driven.
Drill through Filters
1. Import the required data tables into Power BI
- **DimDate: Contains sales dates organized by year, quarter, month and day.
- **DimCustomer: Stores customer details such as first name, last name, gender and marital status.
- **DimGeography: Provides geographical and demographic information related to customers.
- **FactInternetSales: Represents internet-based sales transactions along with related customer data.
- **FactResellerSales: Contains sales information related to resellers.
You can download dataset from here
2. Select the hierarchical tables DimDate, DimGeography, FactInternetSales and FactResellerSales.
3. Load the selected tables to create the data model required for implementing drill-through filters.

Navigator
4. The data model will be loaded in less than a minute.

data model
Steps to Set Up Drill through Filters
**1. Set Up Drill through Target Pages
First decide the field you want to use for drill-through. Here two target pages are created Page 1 supports drill-through by Calendar Year and Page 2 supports drill-through by Country Region. Add the respective fields to the drill-through filters on each target page. Power BI will automatically generate a Back button to enable easy navigation between pages.
- To enable drill-through you need at least two target pages in addition to the Home (navigation) page. Each target page should include relevant visuals for the specific entity you want users to drill into.

two target pages
**Select fields for page 1:
1. For page 1 we have selected "Calendar Year" from the Dim Date Table, "Sum of Sales Amount" from the "Fact Internet Sales" table and "Sum of Sales Amount" from the "Fact Reseller Sales" Table to create a single model.
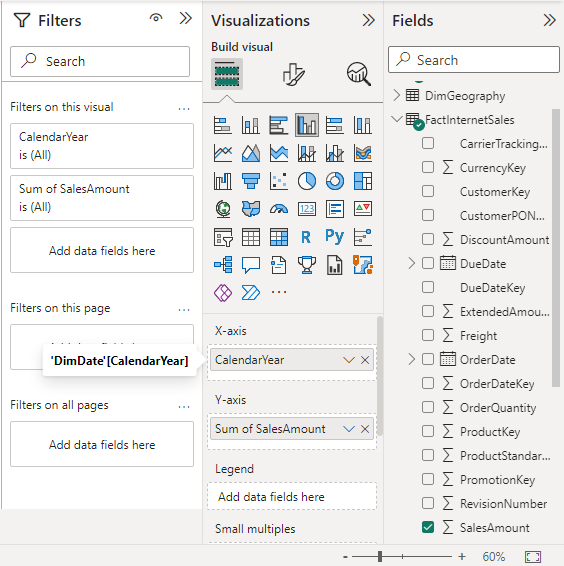
Select fields for page 1
2. Along with it we can move on to other information as well "Sum of Order Quantity" and "Sum of Freight" in card visuals.
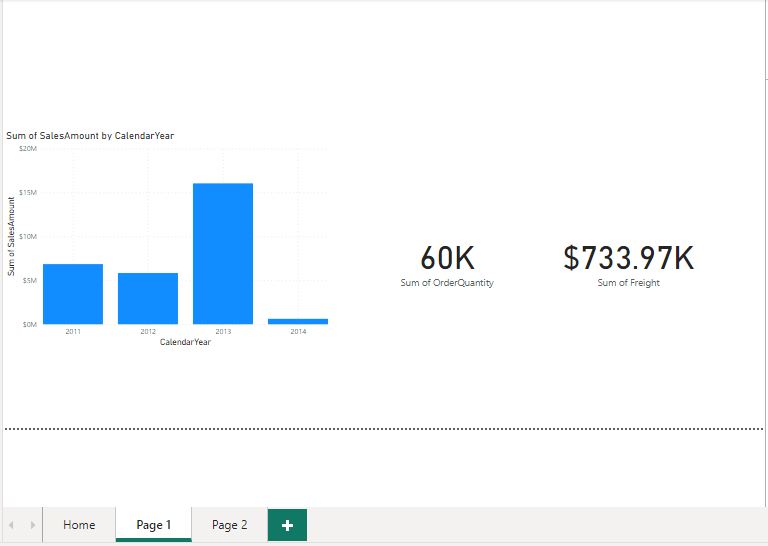
card visuals
**Select fields for page 2:
1. For page 2 we have selected "French Country Region Name" from Dim Geography Table, "Sum of Sales Amount" from the "Fact Reseller Sales" table and "Sum of Sales Order Line Number" from the "Fact Internet Sales" Table to create a single model.
.png)
Select fields for page 2
2. Also convert it into the matrix visualization.
.png)
matrix visualization
3. We can modify the table from the visualizations section. Along with it here we can move on to other information as well, "Sum of Total Product Cost" from the Fact Reseller Sales table in card visuals.

card visuals
2. Pass Filters by Column
A drill-through target page can be set to receive all relevant filters from the source visual. Any temporary filters applied on the source are automatically passed to the target page and appear in italics under the Drill-through section of the Visualizations pane. To retain all applied filters, enable Keep all filters on the destination page.
- Drag the desired field into the Drill-through well on the target page from the Build visual section of the Visualizations pane.
- Once added Power BI automatically creates a Back button which appears as a clickable button in published reports.
- This allows users to easily return to the original source page from which they drilled through.
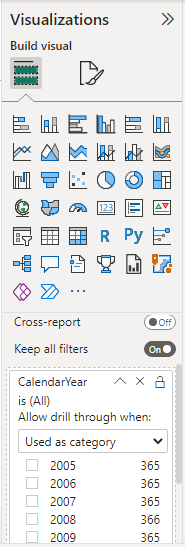
**Drilling through page 1:
1. Drag the field Calendar Year for Page1 Drill through

Drilling through page 1
Visualization
2. The back button is an image that can be replaced with a custom image while retaining its back-navigation functionality. Note that adding custom images is supported only in Power BI Desktop not in the Power BI service.

card visuals
3. On the Home page, add the Calendar Year field used for drill-through. To navigate right-click the desired value (for example, 2005) and select Drill through then Page 1.

Drilling through page 1
4. Data viz. Sum of Sales Amount by Calendar Year visual, Sum of Order Quantity and Sum of Freight of the 2005 calendar year can be seen individually as follows.

Drilling through page 1
5. Let's set the Drill through to the 2013 calendar year field.

calendar year field
6. Data viz. the Sum of Sales Amount by Calendar Year visual, Sum of Order Quantity and Sum of Freight of the 2013 calendar year can be seen individually as follows.

card visuals
**Drilling through page 2:
1. Similarly Drag the "French Country Region Name" from the Dim Geography table for page2 Drill through.
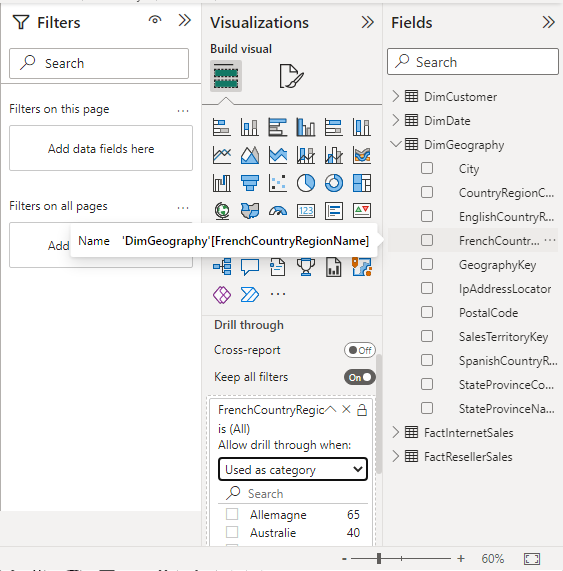
Drilling through page 2
2. On the Home page add the French Country Region Name field used for drill-through. Right-click the France value and select Drill through then Page2.

Drilling through page 2
3. Various Information like the Sum of Sales Amount, Sum of Sales Order Line Number and Sum of Total Product cost related to France's country Region can be seen individually.

Drilling through page 2
The steps below can be used to create a back button using your own image:
- Choose Image from the Insert tab in Power BI Desktop. Locate your image after that, and then put it on the Drill through target page.
- On the Drill through target page, choose your replacement image.
- Set the Action slider to "On" under the Format image window.
- Then set the Type to Back. Now, your image serves as a back button.
When a user right-clicks a data point on a source page the Drill-through option appears in the context menu. Selecting it opens the destination page automatically filtered to the chosen data point. Although tooltips can show details they don’t provide the same seamless navigation which is why drill-through is the recommended approach.
3. Pass Filters by Measure
You can add a measure or a summary numeric column to the Drill through the area in addition to passing all filters to the Drill through the target page. To use the Drill through the field, drag it to the target page's Drill through the card.
**Drilling through page 3:
1. Create Target Page 3 using the DimCustomer table. Add Customer Key, Gender and Marital Status to build the model and include Sum of Sales Amount and Sum of Order Quantity as card visuals for key metrics.

New Target Page
When a field is used in a visual’s Values area drill-through works with measures or summarized numeric columns. On the Home page drag the Gender field and create a new measure to count the number of female customers from the DimCustomer table.
Measure = COUNTROWS(FILTER(DimCustomer,DimCustomer[Gender] = "F"))
2. It will create a Measure column in the Dim Customer table based on which we can Drill through.
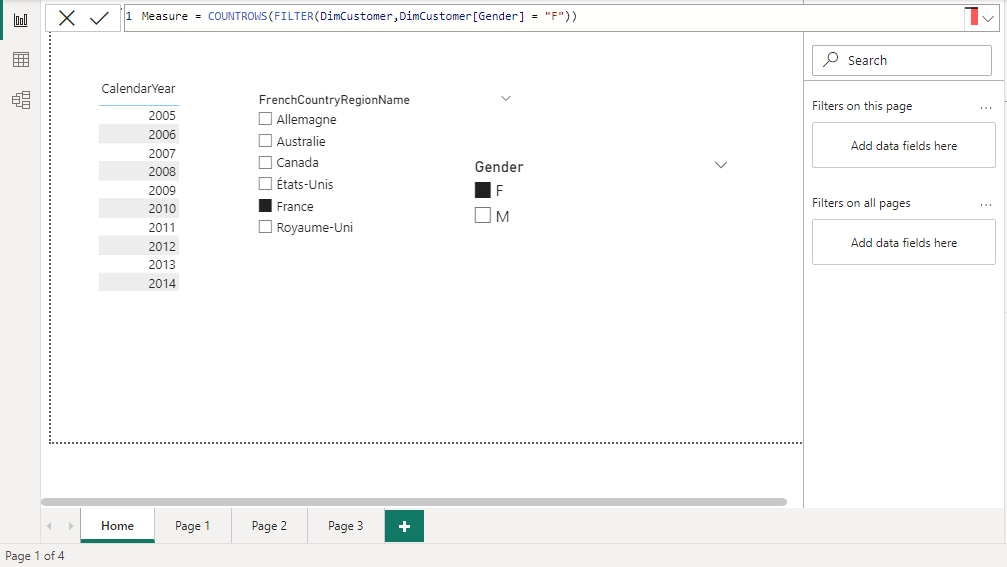
Measure column
3. Drag the Measure field to set up the Drill through.
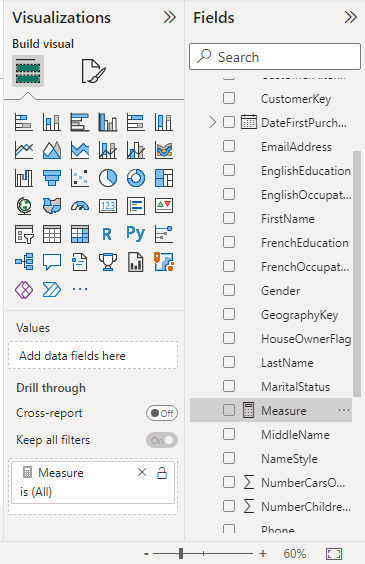
Visualization
4. Drag the Gender field in the "Home" page and select "F" to count the number of Female customers and their details as set up by the measure and Drill through the respective page.

Gender field
5. The respective Female details will be as shown below

card visuals
Setting up Drill through in your reports is as simple as that. It helps to obtain a more detailed look at the entity data you choose for your Drill through the filter.