Power BI How to add Reports to Dashboards? (original) (raw)
Last Updated : 8 Sep, 2025
Power BI Dashboards help you to view and summarize important information from your reports in one place. You can add an entire report or just specific parts like charts, cards or tables to a dashboard. You can also mix multiple reports into one dashboard.
Creating a Dashboard in Power BI
You can create a dashboard from your workspace. Let’s say your workspace is called **geeks_for_geeks and you want to create a dashboard named **gfg_dashboard. The following are the steps:
**Step 1: Go to the required workspace. Click on **New button. A drop-down list appears. Click on the **Dashboard to create a new dashboard.

Creating Dashboard
**Step 2: A box titled **Create dashboard will appear. Type a name for your dashboard i.e gfg_dashboard here and click **Create.
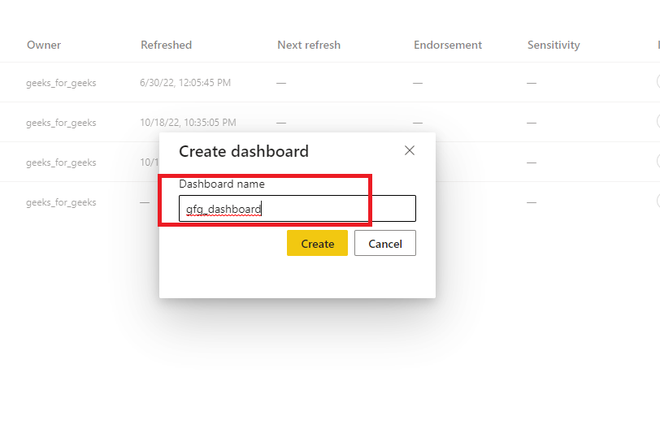
Creating Dashboard
**Step 3: You’ll now see a blank dashboard screen. It will also appear listed in your workspace.
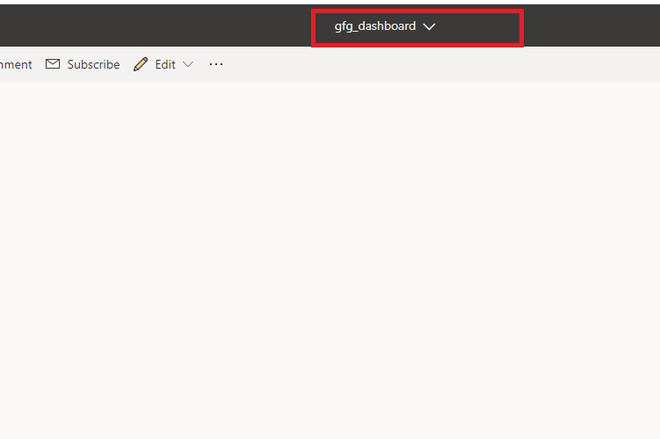
Dashboard Screen
Adding a Complete Report to a Dashboard in Power BI
As we have created a dashboard successfully. Now we can add an entire report to the dashboard. For example you are given a report report1 and you want to add this report to a dashboard. Following are the steps:
**Step 1: Go to the required workspace. Click on the report for which you want to pin it to the dashboard. For example **report1.

Report 1
**Step 2: In the top navigation bar we can see **three dots. Click on it. A drop-down list appears. Click on the **Pin to a dashboard.

Pinning a Dashboard
**Step 3: A new dialogue box name Pin to dashboard is opened. Click on the **existing dashboard radio button. Select the dashboard. For example **gfg_dashboard. Click on the **Pin live button.
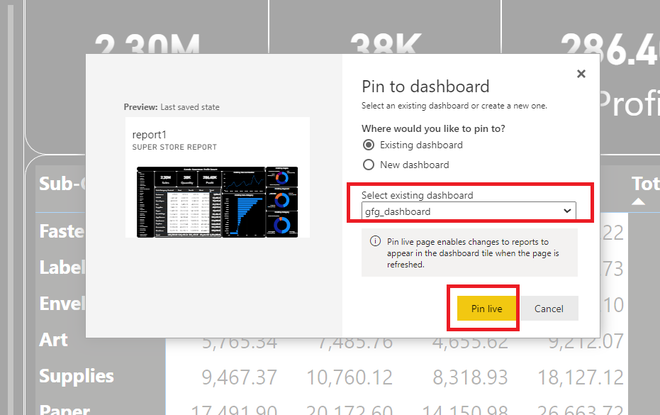
Selecting Dashboard
**Step 4: On the right side of the page a new dialogue box name **Pinned to dashboard appears. Click on **Go to dashboard.

Going to Dashboard
**Step 5: An entire report is added in the **gfg_dashboard successfully.

Report added to Dashboard
Adding Components of Multiple Reports in a Dashboard
We can also add multiple reports and their components in a single dashboard. For example if we want to add a **card from **report1 and a **graph from **report2 in a dashboard name **gfg_dashboard. Following are the steps:
**Step 1: Go to the required workspace. Now we have 2 reports available. Click on the **repor1.

Selecting Report 1
**Step 2: Our task is to add a card name **Quantity to the dashboard. Hover on the card. Now click on the Pin visual button.

Pinning
**Step 3: A dialogue box name Pin to dashboard appears. As we want to add this card in **gfg_dashboard so click on the **Pin button.
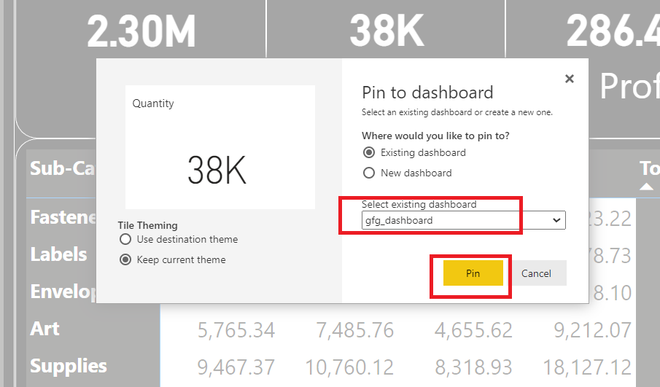
Pinning to Dashboard
**Step 4: A card name Quantity is successfully added to the dashboard.
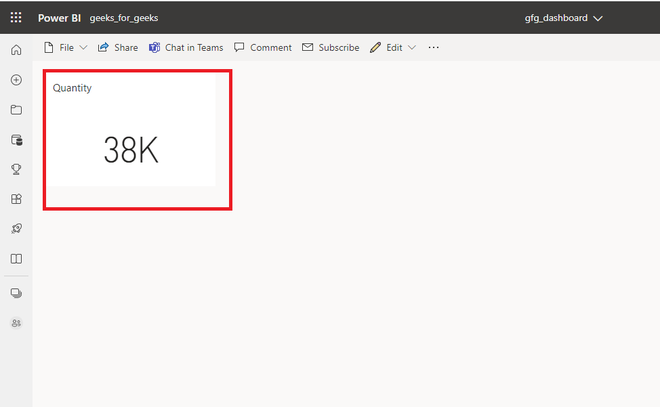
Card Name added to Dashboard
**Step 5: Revert back to your workspace. Select **report2.
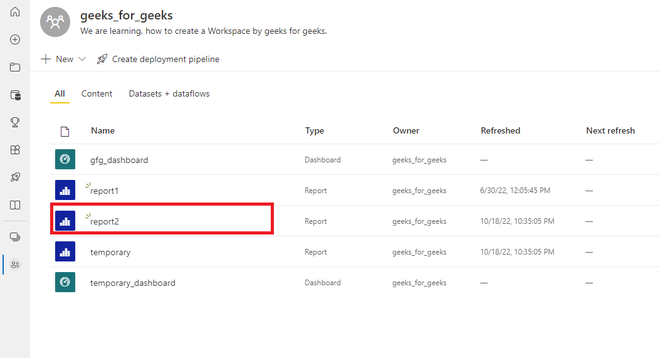
Selecting Report 2
**Step 6: Our task is to add the below-shown graph to our dashboard. **Hover over the graph. Click on the Pin visual button.
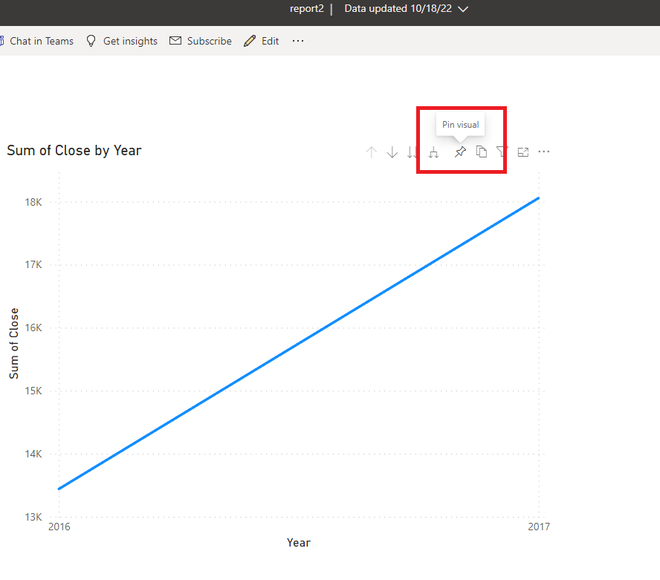
Pinning
**Step 7: A new dialogue box name Pin to dashboard appears. As we want to add this graph in **gfg_dashboard. Click on the **Pin button.
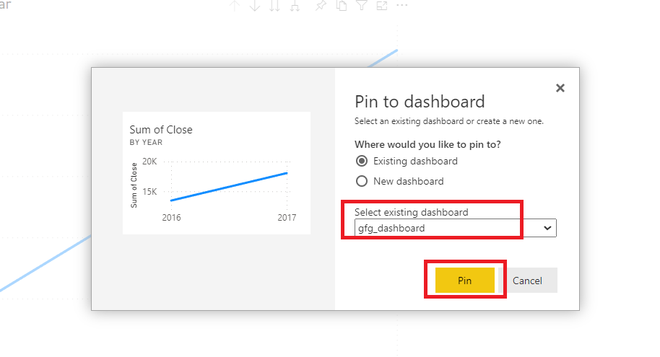
Pinning to Dashboard
**Step 8: A new **graph is added to the same dashboard. We have successfully added a card and a graph from different reports in a dashboard.
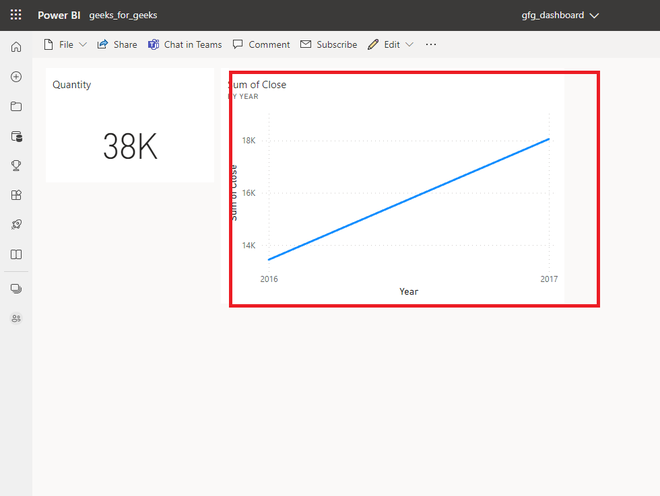
New Graph added to Dashboard
This helps you build a single view that shows only the most important data even if it's from different reports.