Power BI Introduction (original) (raw)
Last Updated : 30 Apr, 2026
Power BI is a data visualization and business intelligence tool developed by Microsoft. It helps convert raw data into clear and meaningful insights through interactive charts, reports and dashboards.
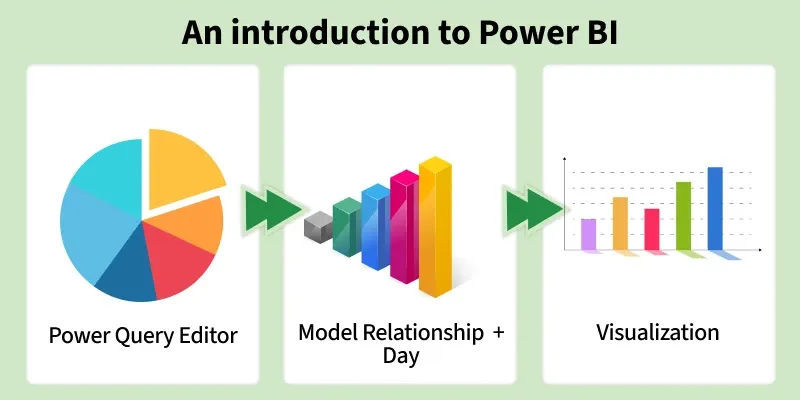
Introduction to Power BI
- **Interactive Visualizations: Allows users to create charts, reports, and dashboards to understand data easily.
- **Data Analysis: Helps identify patterns, trends and important insights from data.
- **Wide Usage: Used in business, research, and many other fields where data analysis is required.
- **Better Decision Making: Makes it easier to analyze data and support data driven decisions.
**Need for Power BI
Power BI is a useful tool that converts raw data into meaningful insights, helping users understand complex information easily and efficiently.
- **Data Visualization: Transforms complex data into clear charts, graphs and dashboards making trends and patterns easy to identify.
- **Better Decision Making: Brings key information into one place, enabling quick and data driven decisions.
- **Real-Time Analysis: Allows live dashboards to monitor data instantly useful for areas like sales, operations and customer support.
- **Multiple Data Sources: Connects seamlessly with Excel, SQL databases and cloud platforms such as Google Analytics and Salesforce.
- **User-Friendly Interface: Offers drag-and-drop features and ready made visuals making it easy to use even without coding knowledge.
**Key Components
Power BI consists of several parts each have a unique role in the data analysis process:
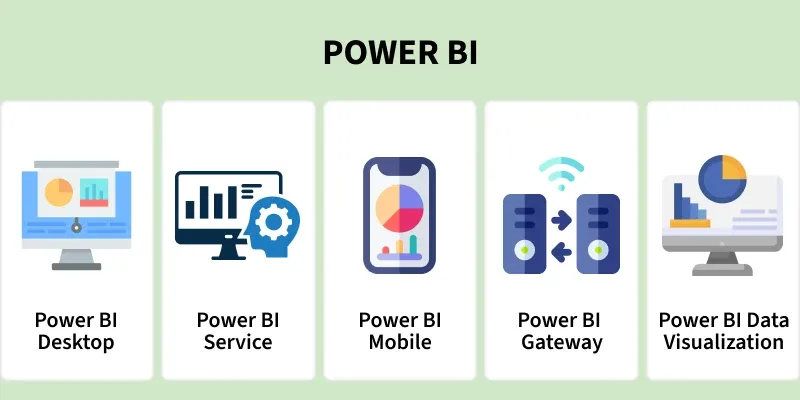
Power Bi Components
- **Power BI Desktop: A free application installed on your computer that allows you to connect to data, clean it and create interactive reports.
- **Power BI Service: The cloud-based version where you can publish, share and access reports and dashboards from anywhere.
- **Power BI Mobile: Mobile apps for iOS and Android that let you view and interact with reports on smartphones and tablets.
- **Power BI Gateway: Enables secure connection between on-premises data sources and Power BI for use in reports and dashboards.
- **Power BI Report Server: Allows organizations to host and share Power BI reports on their own servers instead of the cloud.
- **Power BI Embedded: Lets businesses embed Power BI reports directly into their applications or websites without opening Power BI separately.
**Step-by-Step Guide to use Power BI
Getting started with Power BI is simple. Follow these steps to create insightful reports and dashboards.
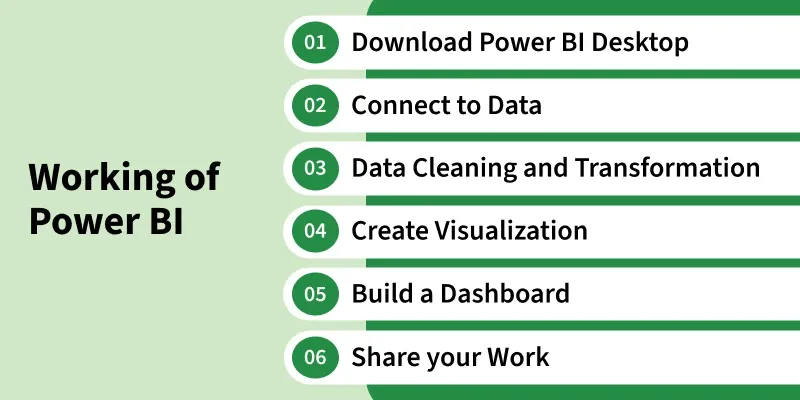
Working of Power BI
**Step 1: Download Power BI Desktop
- Download Power BI Desktop for free from the Microsoft website.
- Install it on your Windows system to start creating reports.
- Provides a clean and easy-to-use workspace.
Step 2: Connect to Your Data
- Click Get Data to connect to Excel, SQL databases or cloud sources.
- Import data from multiple sources into one report.
- Follow simple on-screen steps to load your data.
Step 3: Clean and Transform Data
- Use Power Query to clean and prepare your data.
- Remove unnecessary data and fix data types.
- Ensure accurate and reliable analysis.
Step 4: Create Visualizations
- Drag and drop fields to create charts, graphs and tables.
- Choose visuals that best represent your data.
- Easily identify trends and key insights.
Step 5: Build a Dashboard
- Organize multiple visuals on a single page.
- Create interactive dashboards for better exploration.
- Customize dashboards to highlight important metrics.
- Publish reports to Power BI Service for online access.
- Share dashboards with team members or stakeholders.
- Enable automatic refresh to keep data up to date.
**Power BI Optimization
Power BI optimization focuses on improving report performance, data efficiency and responsiveness. Applying optimization techniques ensures faster load times and a smoother user experience.
- **Learn DAX: Use DAX to perform advanced calculations and generate deeper insights.
- **Master Power Query: Enhance data cleaning and transformation to improve workflow efficiency.
- **Stay Organized: Use clear and meaningful names for fields, measures and reports.
- **Use Templates: Use built-in templates to save time and gain design inspiration.