Power Query Editor in Power BI (original) (raw)
Last Updated : 20 Mar, 2026
Power Query Editor is a Power BI tool used to transform and prepare data. It lets users connect and clean data from multiple sources, then load it for analysis. It is available in Desktop and Online modes. To understand its use more clearly:
- **Data Transformation: Cleans and organizes data before analysis.
- **Handles Multiple Sources: Works with data from Excel, web, SQL and other sources.
- **Improves Data Quality: Removes unwanted rows, splits columns and changes formats.
- **Prepares Data for Analysis: Ensures data is in the right format before creating reports and dashboards.
Launching Power Query Editor
To open the Power Query Editor, click Transform Data under the Home tab in Power BI Desktop. This opens the editor where you can load and transform your data. After opening, you can proceed with the following:
- **Add Data: Load data into the Query Editor.
- **Perform Operations: Apply transformations as required.
- **Prepare for Analysis: Clean and shape data before using it in reports.

Launching Power Query Editor
Importing Data
- In the Power Query Editor, click New Source to add data from sources like Excel, SQL or the web. After importing, you can apply necessary transformations to the data.
- For this example, we use an Excel file named “My movie list.xlsx”, and its data is shown below.

My Movie List.xlsx
On loading this data on the query editor it appears as:
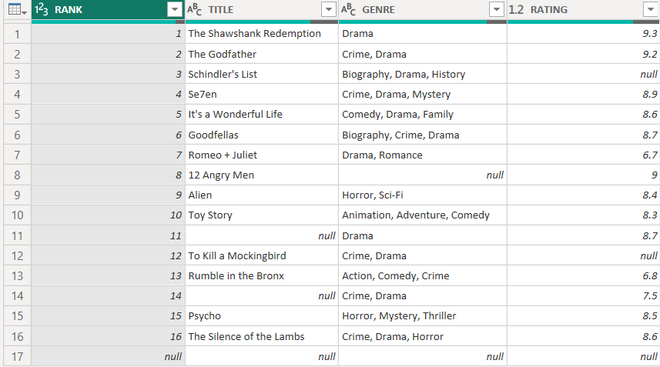
Excel sheet in the power query editor
Common Data Transformations
1. Renaming Elements
The power query editor provides us with a variety of possible renaming. We can rename the data sources or tables, columns and queries. We will look into each of them one by one.
**Rename Data Source
- You can rename a data source by right-clicking on it and selecting the Rename option.
- In this example, the source is renamed from Sheet1 to Movie Data. After renaming, the updated data is shown below.
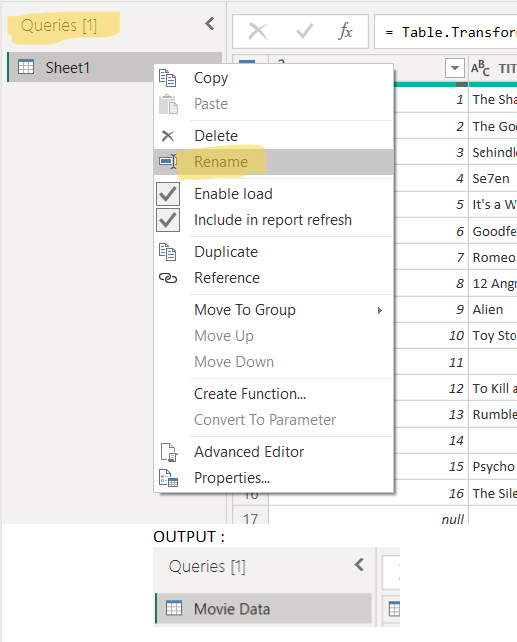
Renamed source to "Movie Data"
**Rename Column
- Rename a column by right-clicking the column and selecting Rename, then entering the desired name.
- Here, the column “TITLE” is renamed to “MOVIE NAME”. The updated column appears as shown.
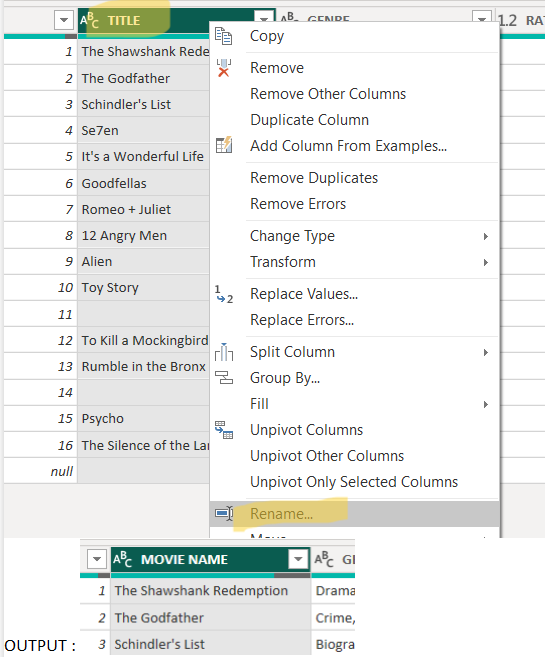
Renamed column to "MOVIE NAME"
**Rename Query
- In the Query Settings pane, the Applied Steps section stores all the changes made as queries. You can rename these queries using the Query Editor.
- Here, the query “Renamed Columns” is renamed to “Columns Name Updation”. After renaming, it appears as shown.
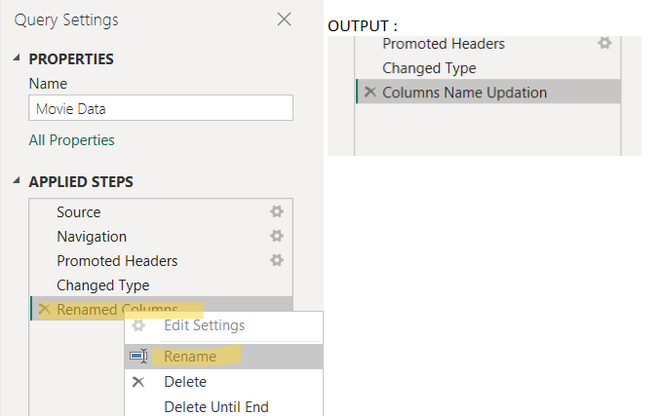
Renamed query to "Columns Name Updation"
- This operation is used to set the first row as column headers. It is available under the Transform tab in the ribbon.
- You can also use the option “Use Headers as First Row” to reverse this action if needed.
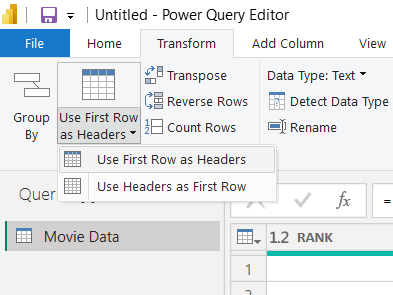
Set First Row as Headers
3. Change Data Types of a Column in Power BI
- You can change a column’s data type by right-clicking the column, selecting Change Type, and choosing the required type (e.g., Whole Number to Decimal Number). You can also do this from the Home tab under Data Type.
- For example, the “RANK” column was changed from whole numbers (1, 2, 3) to decimal values (1.2, 2.3, 3.4).
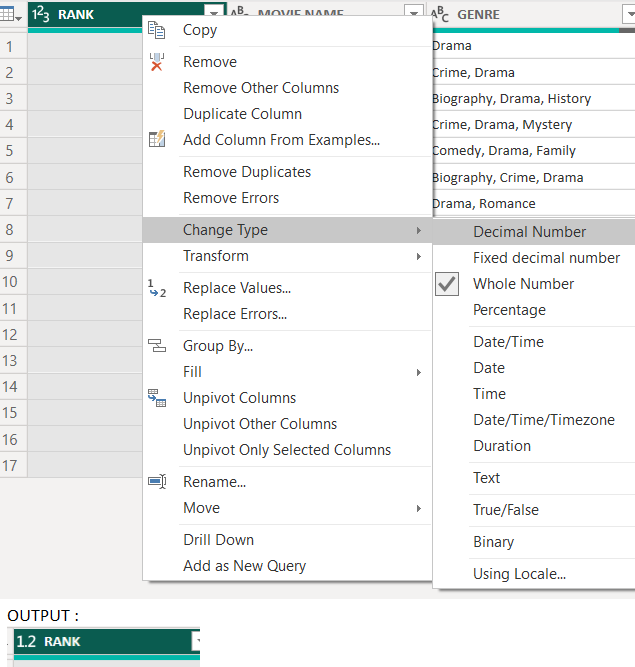
Changed data type to "Decimal Number"
4. Format Operation in Power BI
The Format feature in the Transform tab is used to modify and clean text data in Power BI. It includes:
- **Change Case : Convert text to uppercase or lowercase
- **Add Prefix/Suffix : Add text at the beginning or end
- **Trim : Remove extra spaces
- **Clean : Remove non-printable characters
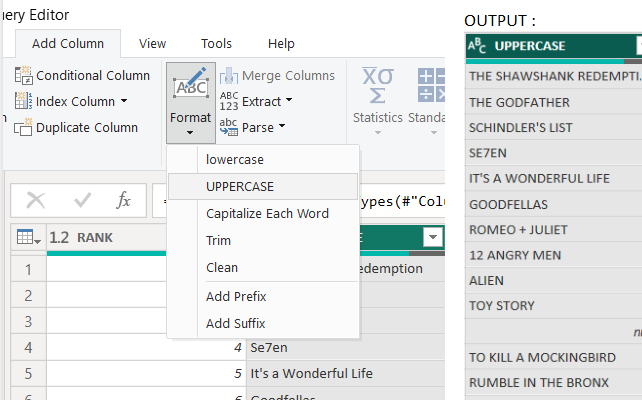
Formatting the text to UPPERCASE
5. Removal Operation in Power BI
**Remove Row Operation
The Reduce Rows feature in the Home tab is used to remove unwanted rows in Power BI. It provides options to remove or keep specific rows based on your requirement. It includes:
- **Remove Rows : Delete top, bottom, alternate, duplicate, blank or error rows
- **Keep Rows : Keep only selected rows and remove the rest
- **Easy Operations : All options work in a similar way (e.g., removing bottom rows)
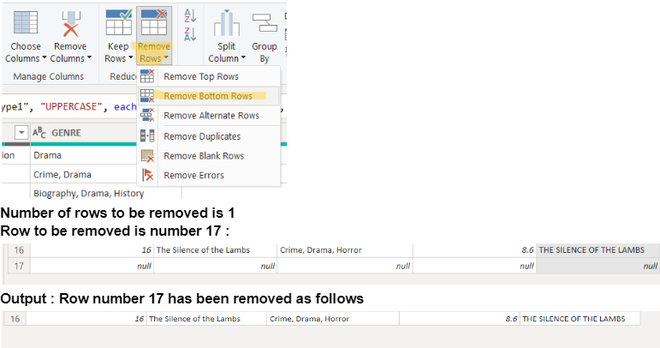
Removing the bottom row
**Remove Column Operation
The Remove Columns feature is used to delete one or more columns in Power BI. It is available under the Home tab in the Manage Columns section. It includes:
- **Remove Columns : Deletes the selected column
- **Remove Other Columns : Keeps selected column and removes the rest
- **Example : Removing the “RATING” column removes it from the dataset
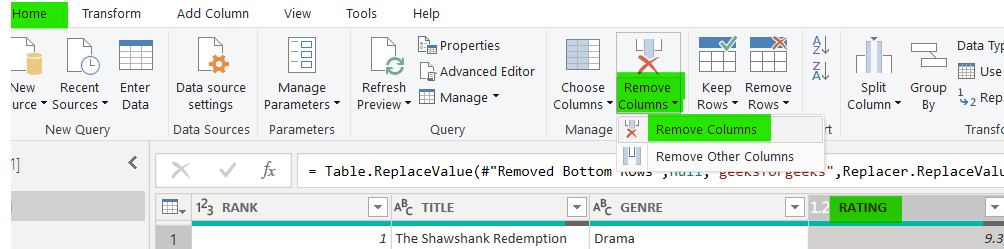
Removing Column Rating
**Output:

"RATING" column has been successfully removed.
6. Merge Operation in Power BI
The Merge Columns feature is used to combine multiple columns into one. It is available under the Add Column tab. It includes:
- **Select Columns : Hold Ctrl and select multiple columns
- **Merge Columns : Choose the merge option and set a column name
- **Add Separator : Define a separator (e.g., “ ; ) ”) between values
- **Example : Columns “GENRE” and “RATING” are merged into a new column named “Merged”
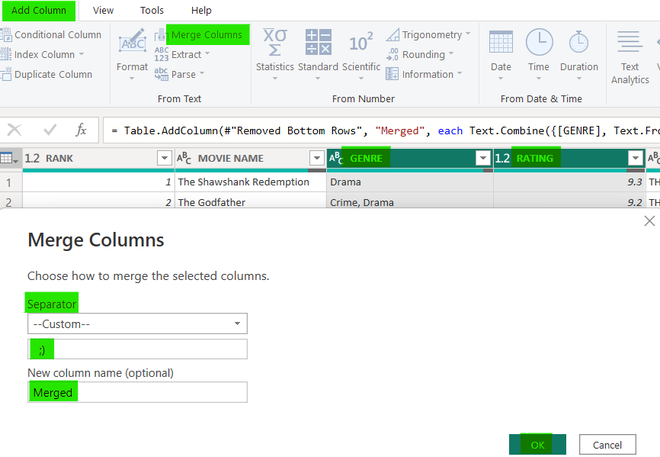
Merging Columns GENRE and RATING
**Output:

Merged Column
7. Replace Values Operation in Power BI
Replace values operation replaces some specific value to our desired value. It's present in the "Transform" bar as "Replace Values". Here, we have replaced "null" to "geeksforgeeks" for column "GENRE".
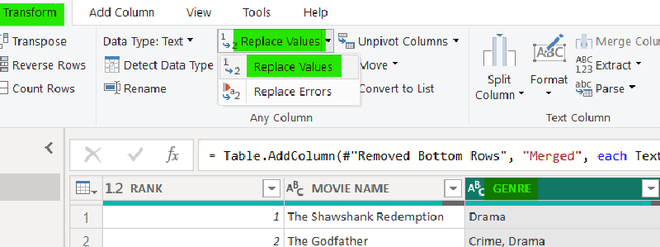
Replacing values of column "GENRE"
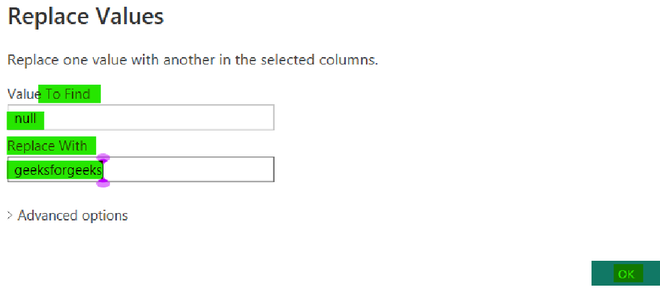
Replacing "null" to "geeksforgeeks"
**Output:

Successfully Replaced
8. Split Column Operation in Power BI
The Split Column feature is available under the Transform tab and is used to divide a column into multiple columns. It includes:
- **Split Options : Split by delimiter, number of characters, or position
- **Example : Column “Merged” is split using delimiter “ ; ) ”
- **Output : Creates new columns like “Merged.1” and “Merged.2”
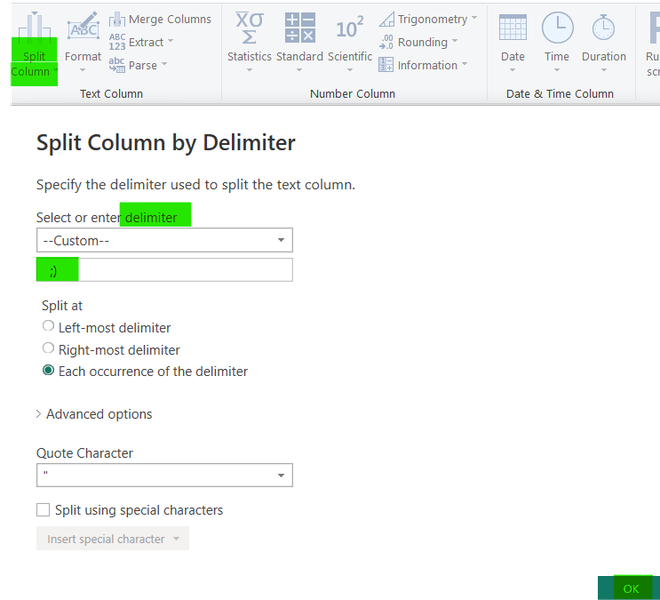
Splitting column "Merged"
**Before

Before Split Scenario
**After

After Split Scenario
9. Pivot Column Operation in Power BI
The Pivot Column feature is used to convert rows into columns. It is available under the Transform tab in Power BI. It includes:
- **Row to Column Conversion : Transforms row values into columns
- **Aggregation Options : Default is Sum, but can be changed to Min, Max or Don’t Aggregate
- **Flexible Usage : Choose aggregation based on requirement
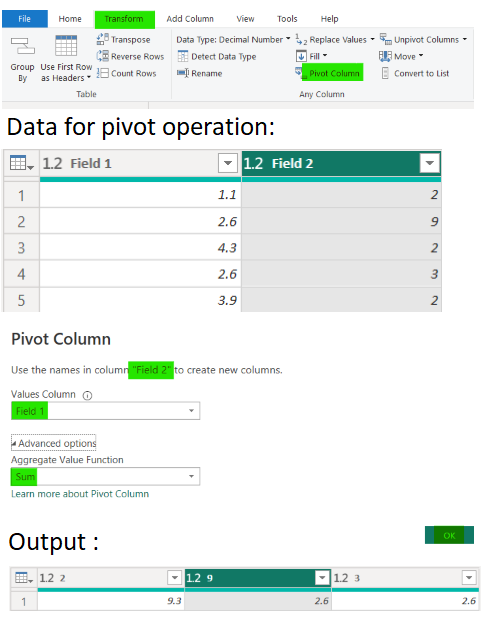
Pivot column "Field 2"
10. Unpivot Column Operation in Power BI
The Unpivot Column feature is used to convert columns into rows, which is the opposite of pivot. It gathers similar values under a single column with corresponding labels. It includes:
- **Column to Row Conversion : Converts multiple columns into rows
- **Organizes Data : Combines values under one label for better structure
- **Opposite of Pivot : Reverses the pivot operation
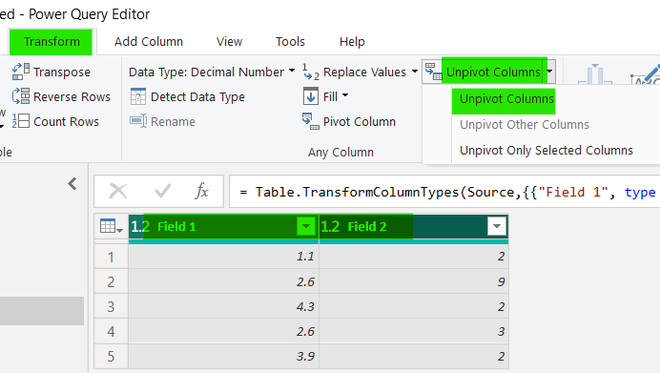
Unpivot operation implemented on Field 1 and Field 2 both
**Output:
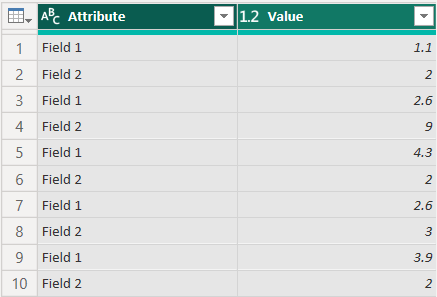
On unpivoting both the columns