Introduction to Matplotlib (original) (raw)
Last Updated : 11 Jul, 2025
Matplotlib is a powerful and versatile open-source plotting library for Python, designed to help users visualize data in a variety of formats. Developed by John D. Hunter in 2003, it enables users to graphically represent data, facilitating easier analysis and understanding. If you want to convert your boring data into interactive plots and graphs, Matplotlib is the tool for you.
To learn Matplotlib from scratch to detail, refer to our article: Matplotlib Tutorial.
**Example of a Plot in Matplotlib:
Let's create a simple line plot using Matplotlib, showcasing the ease with which you can visualize data.
Python `
import matplotlib.pyplot as plt
x = [0, 1, 2, 3, 4] y = [0, 1, 4, 9, 16]
plt.plot(x, y) plt.show()
`
**Output:
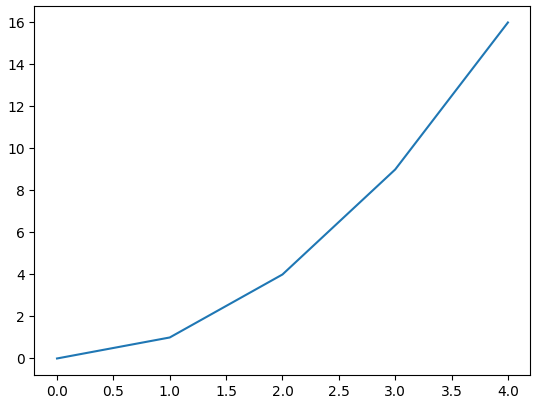
Simplest plot in Matplotlib
Components or Parts of Matplotlib Figure
**Anatomy of a Matplotlib Plot: This section dives into the key components of a Matplotlib plot, including figures, axes, titles, and legends, essential for effective data visualization.

The parts of a Matplotlib figure include (as shown in the figure above):
- **Figure: The overarching container that holds all plot elements, acting as the canvas for visualizations.
- **Axes: The areas within the figure where data is plotted; each figure can contain multiple axes.
- **Axis: Represents the x-axis and y-axis, defining limits, tick locations, and labels for data interpretation.
- **Lines and Markers: Lines connect data points to show trends, while markers denote individual data points in plots like scatter plots.
- **Title and Labels: The title provides context for the plot, while axis labels describe what data is being represented on each axis.
Matplotlib Pyplot
Pyplot is a module within Matplotlib that provides a MATLAB-like interface for making plots. It simplifies the process of adding plot elements such as lines, images, and text to the axes of the current figure. **Steps to Use Pyplot:
- **Import Matplotlib: Start by importing matplotlib.pyplot as plt.
- **Create Data: Prepare your data in the form of lists or arrays.
- **Plot Data: Use plt.plot() to create the plot.
- **Customize Plot: Add titles, labels, and other elements using methods like plt.title(), plt.xlabel(), and plt.ylabel().
- **Display Plot: Use plt.show() to display the plot.
Let's visualize a basic plot, and understand basic components of matplotlib figure:
Python `
import matplotlib.pyplot as plt
x = [0, 2, 4, 6, 8] y = [0, 4, 16, 36, 64]
fig, ax = plt.subplots()
ax.plot(x, y, marker='o', label="Data Points")
ax.set_title("Basic Components of Matplotlib Figure") ax.set_xlabel("X-Axis") ax.set_ylabel("Y-Axis")
plt.show()
`
**Output:

Basic Components of matplotlib figure
Different Types of Plots in Matplotlib
Matplotlib offers a wide range of plot types to suit various data visualization needs. Here are some of the most commonly used types of plots in Matplotlib:
- 1. Line Graph
- 2. Bar Chart
- 3. Histogram
- 4. Scatter Plot
- 5. Pie Chart
- 6. 3D Plot
and many more..

Bar chart and Pie chart
For learning about the different types of plots in Matplotlib, please read Types of Plots in Matplotlib****.**
Key Features of Matplotlib
- **Versatile Plotting: Create a wide variety of visualizations, including line plots, scatter plots, bar charts, and histograms.
- **Extensive Customization: Control every aspect of your plots, from colors and markers to labels and annotations.
- **Seamless Integration with NumPy: Effortlessly plot data arrays directly, enhancing data manipulation capabilities.
- **High-Quality Graphics: Generate publication-ready plots with precise control over aesthetics.
- **Cross-Platform Compatibility: Use Matplotlib on Windows, macOS, and Linux without issues.
- **Interactive Visualizations: Engage with your data dynamically through interactive plotting features.
What is Matplotlib Used For?
Matplotlib is a Python library for data visualization, primarily used to create static, animated, and interactive plots. It provides a wide range of plotting functions to visualize data effectively.
Key Uses of Matplotlib:
- **Basic Plots: Line plots, bar charts, histograms, scatter plots, etc.
- **Statistical Visualization: Box plots, error bars, and density plots.
- **Customization: Control over colors, labels, gridlines, and styles.
- **Subplots & Layouts: Create multiple plots in a single figure.
- **3D Plotting: Surface plots and 3D scatter plots using mpl_toolkits.mplot3d.
- **Animations & Interactive Plots: Dynamic visualizations with FuncAnimation.
- **Integration: Works well with Pandas, NumPy and Jupyter Notebooks.
Let's dive into the concept of Pyplot in the next article, for in-depth understanding of how to create basic plots, customizing them and more advanced features.