Pandas DataFrame corr() Method (original) (raw)
Last Updated : 07 Oct, 2024
Pandas dataframe.corr() is used to find the pairwise correlation of all columns in the Pandas Dataframe in Python. Any NaN values are automatically excluded. To ignore any non-numeric values, use the parameter numeric_only = True. In this article, we will learn about DataFrame.corr() method in Python.
Pandas DataFrame corr() Method Syntax
**Syntax: DataFrame.corr(self, method='pearson', min_periods=1, numeric_only = False)
**Parameters:
- **method:
- pearson: standard correlation coefficient
- kendall: Kendall Tau correlation coefficient
- spearman: Spearman rank correlation
- **min_periods: Minimum number of observations required per pair of columns to have a valid result. Currently only available for pearson and spearman correlation
- **numeric_only: Whether only the numeric values are to be operated upon or not. It is set to False by default.
**Returns: count :y : DataFrame
Pandas Data Correlations corr() Method
A good correlation depends on the use, but it is safe to say you have at least 0.6 (or -0.6) to call it a good correlation. A simple example to show how correlation work in Python.
Python `
import pandas as pd
df = { "Array_1": [30, 70, 100], "Array_2": [65.1, 49.50, 30.7] }
data = pd.DataFrame(df)
print(data.corr())
`
**Output
Array_1 Array_2 Array_1 1.000000 -0.990773
Array_2 -0.990773 1.000000
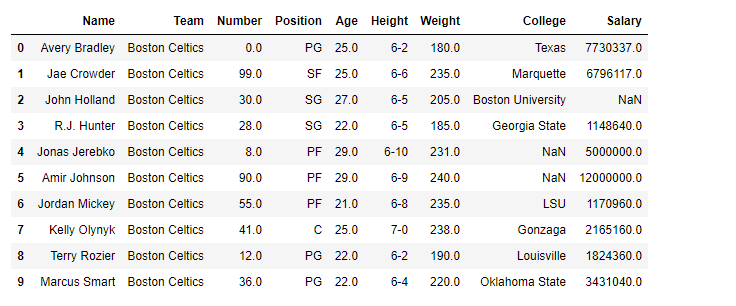
Creating Sample Dataframe
Printing the first 10 rows of the Dataframe.
**Note: The correlation of a variable with itself is 1. For a link to the CSV file Used in Code, click here.
Python `
importing pandas as pd
import pandas as pd
Making data frame from the csv file
df = pd.read_csv("nba.csv")
Printing the first 10 rows of the data frame for visualization
df[:10]
`
**Output
Python Pandas DataFrame corr() Method Examples
Find Correlation Among the Columns Using pearson Method
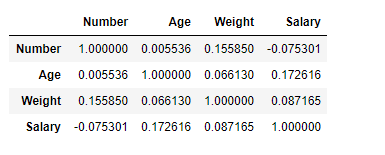
Here, we are using corr() function to find the correlation among the columns in the Dataframe using 'Pearson' method. We are only having four numeric columns in the Dataframe. The output Dataframe can be interpreted as for any cell, row variable correlation with the column variable is the value of the cell. As mentioned earlier, the correlation of a variable with itself is 1. For that reason, all the diagonal values are 1.00.
Python `
To find the correlation among
the columns using pearson method
df.corr(method='pearson')
`
**Output
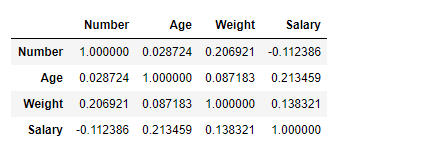
Find Correlation Among the Columns Using Kendall Method
Use Pandas df.corr() function to find the correlation among the columns in the Dataframe using 'kendall' method. The output Dataframe can be interpreted as for any cell, row variable correlation with the column variable is the value of the cell. As mentioned earlier, the correlation of a variable with itself is 1. For that reason, all the diagonal values are 1.00.
Python `
importing pandas as pd
import pandas as pd
Making data frame from the csv file
df = pd.read_csv("nba.csv")
To find the correlation among
the columns using kendall method
df.corr(method='kendall')
`
**Output