Change the legend position in Matplotlib (original) (raw)
Last Updated : 23 Jul, 2025
In this article, we will learn how to Change the legend position in Matplotlib. Let's discuss some concepts :
- Matplotlib is a tremendous visualization library in Python for 2D plots of arrays. Matplotlib may be a multi-platform data visualization library built on NumPy arrays and designed to figure with the broader SciPy stack. It had been introduced by John Hunter within the year 2002.
- A legend is an area describing the elements of the graph. In the matplotlib library, there’s a function called legend() which is used to Place a legend on the axes.
- The attribute Loc in legend() is used to specify the location of the legend.Default value of loc is loc=”best” (upper left). The strings best upper right, upper left, lower left, lower right, right, center left, center right, lower center, upper center, and center place the legend at the corresponding corner of the axes/figure.
| **Location String | **Location String |
|---|---|
| best | 0 |
| upper right | 1 |
| upper left | 2 |
| lower left | 3 |
| lower right | 4 |
| right | 5 |
| center left | 6 |
| center right | 7 |
| lower center | 8 |
| upper center | 9 |
| center | 10 |
**Approach:
- Import Library (Matplotlib)
- Import / create data.
- Plot a chart.
- Add legend.
- Set position of legend using loc.
**Example 1:
Python `
importing packages
import numpy as np import matplotlib.pyplot as plt
create data
x = np.linspace(1, 50, 50) np.random.seed(1) y = np.random.randint(0, 20, 50)
plot graph
plt.plot(x, y)
add legend
plt.legend(['Legend']) plt.show()
`
**Output:
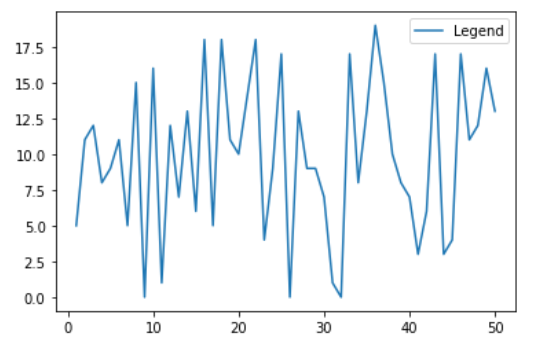
Without setting location of legend (best)
**Example 2:
Python `
importing packages
import numpy as np import matplotlib.pyplot as plt
create data
x = np.linspace(1, 50, 50) np.random.seed(1) y = np.random.randint(0, 20, 50)
plot graph
plt.plot(x, y)
add legend and set position to upper left
plt.legend(['Legend'], loc='upper left') plt.show()
`
**Output:
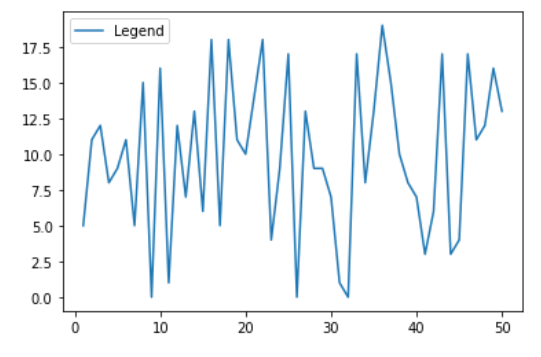
Legend in upper left
**Example 3:
Python `
importing packages
import numpy as np import matplotlib.pyplot as plt
create data
x = np.linspace(1, 50, 50) np.random.seed(1) y = np.random.randint(0, 20, 50)
plot graph
plt.plot(x, y)
add legend and set position to lower left i.e; 4
plt.legend(['Legend'], loc=4) plt.show()
`
**Output:
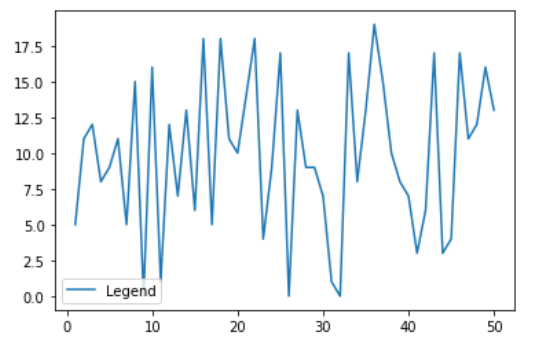
Legend in lower left
**Example 4:
Python `
importing packages
import numpy as np import matplotlib.pyplot as plt
create data
x = np.linspace(1, 50, 50) np.random.seed(1) y = np.random.randint(0, 20, 50)
plot graph
plt.plot(x, y)
add legend and set position to lower right
plt.legend(['Legend'], loc='lower right') plt.show()
`
**Output:
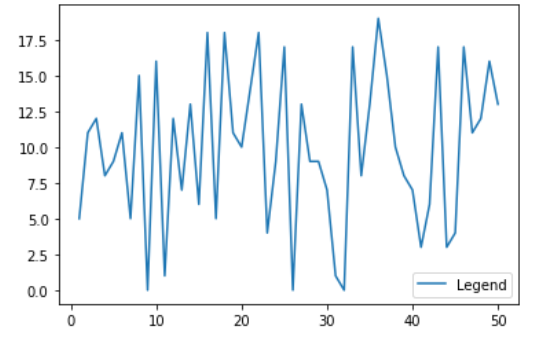
Legend in lower right