Choropleth Maps using Plotly in Python (original) (raw)
Last Updated : 04 Aug, 2025
Choropleth maps are an effective way to visualize geographical data by shading regions based on the value of a variable. These maps are commonly used to represent metrics such as population density, economic indicators or election results across regions. Python's Plotly library provides a straightforward way to create choropleth maps with minimal effort, making it a solid choice for data scientists and developers.
Key characteristics
- **Color gradient representation: Data values are typically represented using a light-to-dark color scale.
- **Spatial pattern visualization: Choropleth maps allow easy identification of geographical patterns.
- **Geographic context: They leverage spatial relationships, making them ideal for datasets with geographical attributes.
**Example: A choropleth map showing unemployment rates by state in the U.S. can quickly highlight economically distressed areas.
To build such maps, we need:
- A dataset with numerical values tied to geographical identifiers (like state codes or country codes).
- A GeoJSON file (or equivalent) defining the boundaries of regions.
Plotly simplifies this by supporting built-in GeoJSON datasets for common boundaries such as U.S. states or world countries.
Why Use Plotly for Choropleth Maps
Plotly is an open-source Python visualization library. It supports both high-level APIs (plotly.express) for quick maps and low-level APIs (plotly.graph_objects) for detailed customization.
Advantages of Plotly
- **Interactive by default: Users can hover, zoom and pan maps.
- **Flexible rendering: Works with Jupyter notebooks and standalone HTML.
- **Balance of simplicity and functionality: Easy for beginners and also customizable for advanced users.
Comparison with alternatives:
- **Matplotlib (Basemap): Good for static maps but lacks interactivity.
- **GeoPandas: Great for geospatial analysis but requires more effort for interactive visualization.
Implementation: Creating a Choropleth Map with Plotly
We'll create a choropleth map showing population estimates for U.S. states. Darker colors will represent higher populations.
Prerequisites
Before we begin, ensure the following libraries are installed:
Python `
!pip install plotly pandas
`
Step 1: Prepare the Data
- Created a sample dataset containing state names, two-letter state codes and population estimates.
- The state codes will be used as location identifiers in Plotly. Python `
import pandas as pd
Sample dataset
data = { 'State': ['California', 'Texas', 'Florida', 'New York', 'Illinois'], 'State_Code': ['CA', 'TX', 'FL', 'NY', 'IL'], 'Population': [39538223, 29145505, 21538187, 20201249, 12812508] } df = pd.DataFrame(data)
`
Step 2: Create the Choropleth Map
Used px.choropleth() from Plotly Express.
- **locations: Column with state codes.
- **locationmode: Set to USA-states for U.S. state boundaries.
- **color: The column used to determine shading (Population).
- **scope: Restrict the map to U.S. boundaries. Python `
import plotly.express as px
Create the choropleth map
fig = px.choropleth( df, locations='State_Code', locationmode='USA-states', color='Population', hover_name='State', color_continuous_scale='Viridis', scope='usa', title='U.S. State Population Estimates' )
`
Step 3: Improve Map Layout and Display
Customize layout for better presentation.
- **geo: Remove the frame and show coastlines.
- **projection_type: Use "Albers USA" projection for better U.S. map representation. Python `
Update layout and display map
fig.update_layout( geo=dict(showframe=False, showcoastlines=True, projection_type='albers usa'), margin=dict(l=0, r=0, t=50, b=0) )
fig.show()
`
**Output:
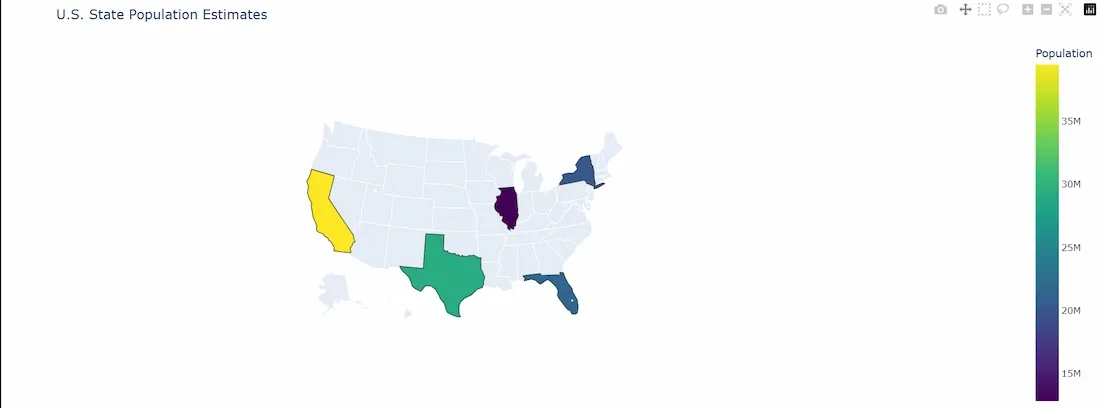
Chloropleth Map
Step 4: Customizing the Map
- Plotly supports extensive customization:
- Change color scales:
- Add extra data to the hover tooltip. Python `
fig = px.choropleth( df, locations='State_Code', locationmode='USA-states', color='Population', hover_name='State', hover_data=['Population'], color_continuous_scale='Blues', scope='usa', title='U.S. State Population Estimates' ) fig.show()
`
**Output:
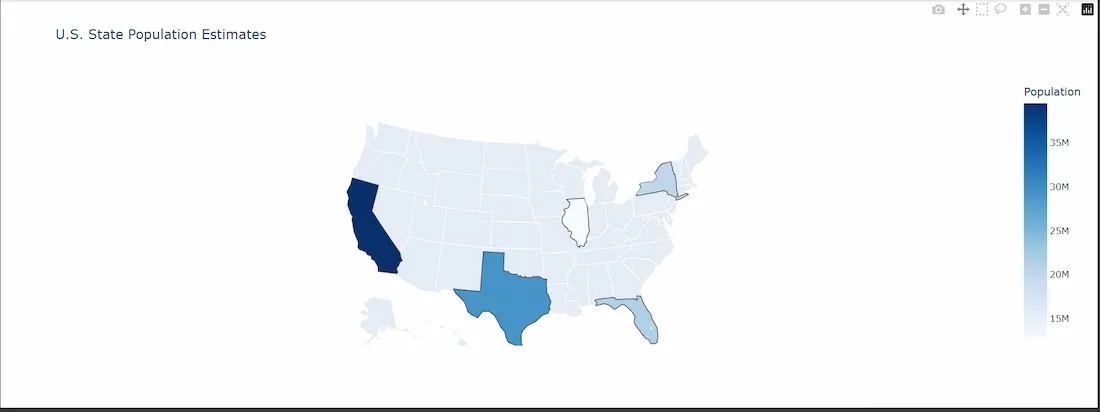
Plotly map 2
Edge Cases and Limitations
**1. Data Quality: Ensure geographical codes in the dataset align with those expected by Plotly to prevent missing or incorrect location data, which can result in blank regions on the map.
**2. GeoJSON Requirements: For custom regions such as cities, districts or postal codes, supply a corresponding GeoJSON file that accurately defines the region boundaries.
**3. Color Scale Selection: Choose sequential color scales like Viridis for continuous data to enhance readability. Avoid diverging color scales (e.g., red-blue) for single-metric data to prevent misinterpretation.