Detecting Multicollinearity with VIF Python (original) (raw)
Last Updated : 20 Nov, 2025
Multicollinearity occurs when two or more independent variables are highly correlated which leads to unstable coefficient estimates and reduces model reliability. This makes it difficult to identify the individual effect of each predictor on the dependent variable. The Variance Inflation Factor (VIF) is used to detect multicollinearity in regression analysis. In this article, we’ll see VIF and how to use it in Python to identify multicollinearity.
Detecting Multicollinearity with VIF
Mathematics behind Variance Inflation Factor (VIF)
VIF shows how much the variance of a regression coefficient increases due to multicollinearity. For each variable, we run a regression where that variable becomes the dependent variable and the remaining variables act as predictors. This gives an R-squared(R^2) value that tells how well one variable can be predicted using the others.
**Formula for VIF is:
VIF=\frac{1}{1-R^2}
- R² ranges from 0 to 1.
- A higher R² means the variable is highly predictable from other variables -> higher VIF.
- If R² is close to 1, the variable is almost fully explained by others -> strong multicollinearity.
Since VIF increases as R² increases, a higher VIF indicates higher multicollinearity. In practice:
- VIF > 5 -> noticeable multicollinearity
- VIF > 10 -> severe multicollinearity (action needed)
Understanding this formula helps us correctly spot multicollinearity and decide if we should remove or combine variables.
VIF Interpretation
- **VIF ≈ 1: No correlation with other predictors
- **1 < VIF ≤ 5: Mild to moderate correlation (usually fine)
- **VIF > 10: Strong multicollinearity -> take corrective steps
Multicollinearity Detection using VIF in Python
To detect multicollinearity in regression analysis we can implement the Variance Inflation Factor (VIF) using the **statsmodels library. This function calculates the VIF value for each feature in the dataset helping us identify multicollinearity.
Syntax :
statsmodels.stats.outliers_influence.variance_inflation_factor(exog, exog_idx)
**Parameters:
- **exog: Array or DataFrame of independent variables (features).
- exog_idx: Index of the feature for which VIF is calculated.
Consider a dataset of 500 individuals containing their gender, height, weight and Body Mass Index (BMI). Here, Index is the dependent variable and Gender, Height and Weight are independent variables. We will be using Pandas library for its implementation.
You can download the dataset from here.
Python `
import pandas as pd
data = pd.read_csv('/content/BMI.csv')
print(data.head())
`
Output:

Head()
Here we are using the below approch:
- Converting categorical variables like Gender into numeric form.
- Passing each feature index to **variance_inflation_factor() to calculate the VIF.
- Storing the results in a Pandas DataFrame for easy interpretation. Python `
from statsmodels.stats.outliers_influence import variance_inflation_factor
data['Gender'] = data['Gender'].map({'Male':0, 'Female':1})
X = data[['Gender', 'Height', 'Weight']]
vif_data = pd.DataFrame() vif_data["feature"] = X.columns
vif_data["VIF"] = [variance_inflation_factor(X.values, i) for i in range(len(X.columns))] print(vif_data)
`
Output :
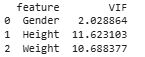
VIF values for Height and Weight
High VIF values for Height and Weight shows strong multicollinearity between these two variables which makes sense because a person’s height influences their weight. Detecting such relationships helps us to understand and improve the stability of our regression models.
What to do if VIF is High?
Here are several effective strategies to address high VIF values and improve model performance:
**1. Removing Highly Correlated Features: Drop one of the correlated features, the one which is less important or with a higher VIF. Removing such features reduces redundancy and improves model interpretability and stability.
**2. Combining Variables or Using Dimensionality Reduction Techniques
- Create new variables such as BMI from height and weight.
- Use Principal Component Analysis (PCA) to convert correlated features into uncorrelated components while keeping most of the data information.