Geospatial Queries with Python MongoDB (original) (raw)
Last Updated : 12 Jul, 2025
Geospatial data plays a crucial role in location-based applications such as mapping, navigation, logistics, and geographic data analysis. **MongoDB provides robust support for geospatial queries using **GeoJSON format and **2dsphere indexes, making it an excellent choice for handling location-based data efficiently.
In this article, we will cover the various ways of using geospatial in MongoDB and explain the GeoJSON polygon and point types
**What is GeoJSON Format in MongoDB?
**GeoJSON is an open-source format based on **JSON (JavaScript Object Notation) that represents geographic features such as points, lines, and polygons. MongoDB supports **GeoJSON objects to store and manipulate geospatial data efficiently. GeoJSON is an open-source format that describes simple geographical features. It includes two essential fields:
- **type: Specifies the GeoJSON object type (e.g., Point, Polygon, MultiPolygon).
- **coordinates: Contains the object’s coordinates. When specifying latitude and longitude, list the longitude first and then the latitude.
**Note: If specifying latitude and longitude coordinates, list the longitude first and then latitude.
Example of GeoJSON Object (Point Representation):
{
"type": "Point",
"coordinates": [-73.856077, 40.848447]
}
**Explanation: Here, **-73.856077 is the **longitude, and **40.848447 is the **latitude.
**Supported GeoJSON Types in MongoDB:
- **Point:
{ "type": "Point", "coordinates": [longitude, latitude] } - **LineString:
{ "type": "LineString", "coordinates": [[lng1, lat1], [lng2, lat2]] } - **Polygon:
{ "type": "Polygon", "coordinates": [[[lng1, lat1], [lng2, lat2], [lng3, lat3], [lng1, lat1]]] } - **MultiPolygon: A collection of multiple polygons.
**Setting Up MongoDB for Geospatial Queries
MongoDB provides two indexing types to work with geospatial data:
2d Index(Legacy Coordinate Pairs) – Used for flat coordinate spaces.2dsphere Index– Used for **real-world spherical calculations (Recommended).
**Step 1: Create a MongoDB Collection and Insert GeoJSON Data
import pymongo
Connect to MongoDB
client = pymongo.MongoClient("your_connection_string")
Select database
db = client["geospatial_db"]
Select collection
locations = db["places"]
Insert a GeoJSON document (Example: A cafe location)
location_data = {
"name": "Central Cafe",
"location": {
"type": "Point",
"coordinates": [-74.006, 40.7128] # Longitude, Latitude
}
}
Insert document
locations.insert_one(location_data)
**Step 2: Create a 2dsphere Index for Efficient Queries
Indexes improve query performance by enabling geospatial computations. Before running geospatial queries, **create an index on the location field:
locations.create_index([("location", pymongo.GEOSPHERE)])
Using Geospatial Queries in MongoDB with Python
MongoDB supports several types of geospatial queries:
**1. Find Nearby Locations ( $near )
Find locations within a certain radius (e.g., within 5 km of a given point). Use $maxDistance (in meters) to filter nearby results.
query = {
"location": {
"$near": {
"$geometry": {
"type": "Point",
"coordinates": [-74.006, 40.7128] # Search around this location
},
"$maxDistance": 5000 # Distance in meters (5 km)
}
}
}
nearby_places = locations.find(query)
for place in nearby_places:
print(place)
**2. Find Points Within a Specific Area ( $geoWithin )
Find locations inside a defined polygon (e.g., a city boundary):
polygon_query = {
"location": {
"$geoWithin": {
"$geometry": {
"type": "Polygon",
"coordinates": [[
[-74.0, 40.7], [-74.02, 40.72], [-74.04, 40.7], [-74.0, 40.7]
]]
}
}
}
}
inside_places = locations.find(polygon_query)
for place in inside_places:
print(place)
**Visualizing Geospatial Data in Python
To analyze and visualize geospatial data stored in **MongoDB, we use **Matplotlib for plotting and **Basemap for mapping geographic locations.
1. Install Required Libraries
To work with geospatial data in Python, install the following modules:
pymongo (MongoDB Client for Python)
This module is used to interact with the MongoDB. To install it type the below command in the terminal.
pip install pymongo
OR
conda install pymongo
Matplotlib (Graph Plotting Library)
This library is used for plotting graphs
pip install matplotlib
Basemap (Map Visualization in Python)
This module is used for plotting maps using Python. To install this module type the below command in the terminal.
conda install basemap
**2. Setting Up MongoDB Atlas
To use **MongoDB Atlas for storing geospatial data, follow these steps:
**3. Implementation: Fetching and Visualizing Geospatial Data
Below is a Python script to connect to **MongoDB Atlas, retrieve geospatial data, and plot it on a map.
**a) Connecting to MongoDB
import pymongo
import pprint
import matplotlib.pyplot as plt
from mpl_toolkits.basemap import Basemap
course_cluster_uri = 'your_connection_string'
course_client = pymongo.MongoClient(course_cluster_uri)
sample Database
db = course_client['sample_geospatial']
sample Collection
shipwrecks = db['shipwrecks']
b) Fetching Geospatial Data
l = list(shipwrecks.find({}))
lngs = [x['londec'] for x in l]
lats = [x['latdec'] for x in l]
c) Plotting Data on a Map
Clear the figure (this is nice if you
execute the cell multiple times)
plt.clf()
Set the size of our figure
plt.figure(figsize =(14, 8))
Set the center of our map with our
first pair of coordinates and set
the projection
m = Basemap(lat_0 = lats[0],
lon_0 = lngs[0],
projection ='cyl')
Draw the coastlines and the states
m.drawcoastlines()
m.drawstates()
Convert our coordinates to the system
that the projection uses
x, y = m(lngs, lats)
Plot our converted coordinates
plt.scatter(x, y)
Display our beautiful map
plt.show()
**Output:
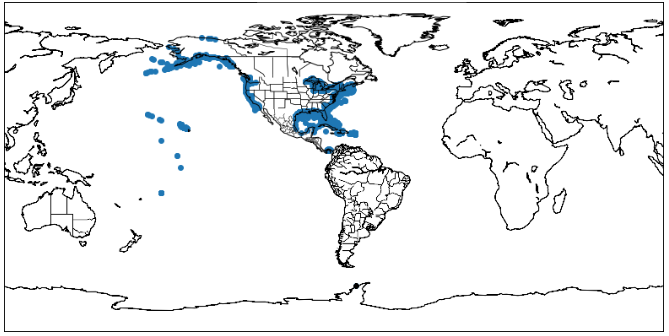
shipwrecks plot
**Explanation:
- The script connects to **MongoDB Atlas and retrieves a collection of shipwreck locations stored in a geospatial dataset. It then extracts the **longitude and latitude coordinates from the dataset to prepare the data for visualization.
- Using **Basemap, the script plots these locations on a **world map, displaying **coastlines and state boundaries to provide geographical context. Finally, the shipwreck locations are visualized as **red dots on the map, allowing for a clear representation of their distribution across different regions.
Conclusion
MongoDB’s geospatial queries provide a powerful way to **store, **index, and analyze location-based data using **GeoJSON and 2dsphere indexes. By using queries like $near and $geoWithin, developers can efficiently search for nearby locations or points within a defined area. Combining MongoDB with Python’s pymongo library, along with visualization tools like Matplotlib and Basemap, makes it easier to work with geospatial data in real-world applications. Whether it's for **navigation, **logistics, ride-sharing, or mapping services, MongoDB offers a scalable and efficient solution for handling geospatial information