Get Financial Data from Yahoo Finance with Python (original) (raw)
Yahoo Finance provides access to financial data which including stock prices, company financials and key metrics. By using the **yfinance Python library we can easily retrieve this data and analyze it for various financial tasks. In this article, we'll see how to use Python to get financial data from Yahoo Finance and display it in a structured format.
Before we start we need to install the yfinance library. We can install it by using pip command:
pip install yfinance
For fetching financial data, we need the ticker symbol of the company. A ticker is a unique series of letters assigned to a security for trading purposes. For example:
- For Amazon, it is "AMZN"
- For Meta, it is "META"
- For Google, it is "GOOGL"
Below are various examples that shows how to retrieve Financial Data from Yahoo Finance. Let us take the results for Meta hence we use the "META" ticker.
Getting basic financial information about Meta we can use .info() function.
Python `
import yfinance as yf meta = yf.Ticker("META") print(meta.info)
`
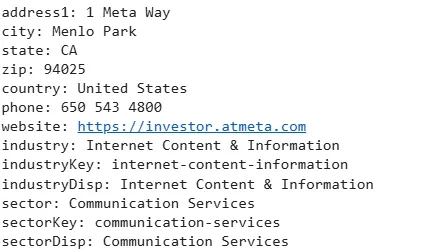
**Output:
{'address1': '1 Meta Way', 'city': 'Menlo Park', 'state': 'CA', 'zip': '94025', 'country': 'United States',-------'trailingPegRatio': 0.7646}
We can fetch financial key metrics like Company Sector, Price Earnings Ratio and Company Beta from the above dictionary of items quickly.
Python `
import yfinance as yf meta = yf.Ticker("META") print("Company Sector:", meta.info['sector']) print("P/E Ratio:", meta.info['trailingPE']) print("Company Beta:", meta.info['beta'])
`
**Output :
Company Sector: Communication Services
P/E Ratio: 20.967308
Company Beta: 1.279
Though we have fetched few financial key metrics in a dictionary format we can split that by using key-value pair.
Python `
import yfinance as yf meta = yf.Ticker("META") for key, value in meta.info.items(): print(f"{key}: {value}")
`
**Output :
META information in key-value pairs
To get the historical market data such as stock prices we can use the **history() method. Fetching Meta’s stock prices for the maximum available period and displaying it in a tablular format.
Python `
import yfinance as yf meta = yf.Ticker("META") data = meta.history(period="max") print(data.to_string())
`
**Output :
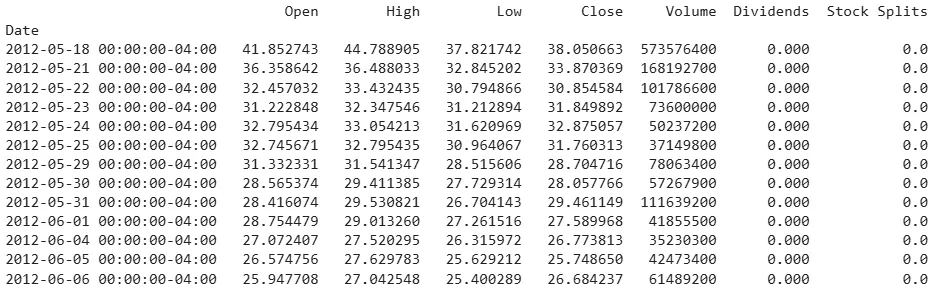
META historic data
If we want to display all the rows of a ticker symbol we will use Pandas function and set the **set_option() function to display maximum rows.
Python `
import yfinance as yf import pandas as pd meta = yf.Ticker("META") data = meta.history(period="max") pd.set_option('display.max_rows', None) print(data.to_string())
`
**Output:
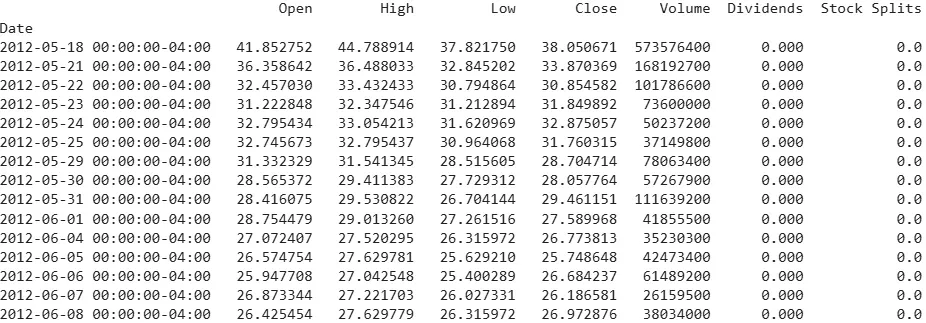
META historic data for all rows
**Example 6: Getting Historical Data for a Specific Period
We can specify a custom date range to fetch historical data. Here’s we used for Meta to get information from May 31, 2019 to January 30, 2021.
Python `
import datetime import yfinance as yf start_date = datetime.datetime(2019, 5, 31) end_date = datetime.datetime(2021, 1, 30) meta = yf.Ticker("META") data = meta.history(start=start_date, end=end_date) print(data.to_string())
`
**Output:
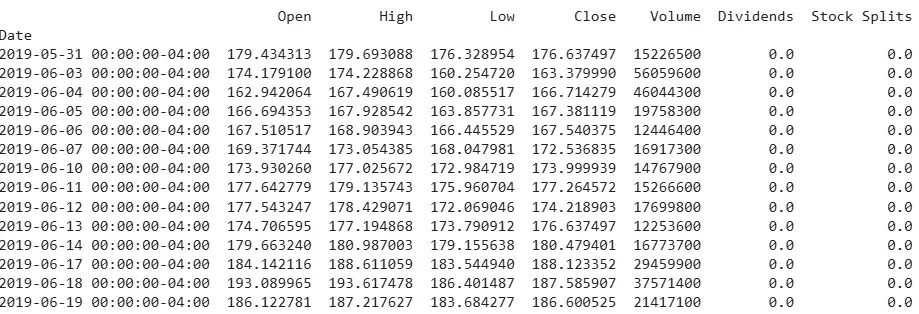
META information from 2019/05/31
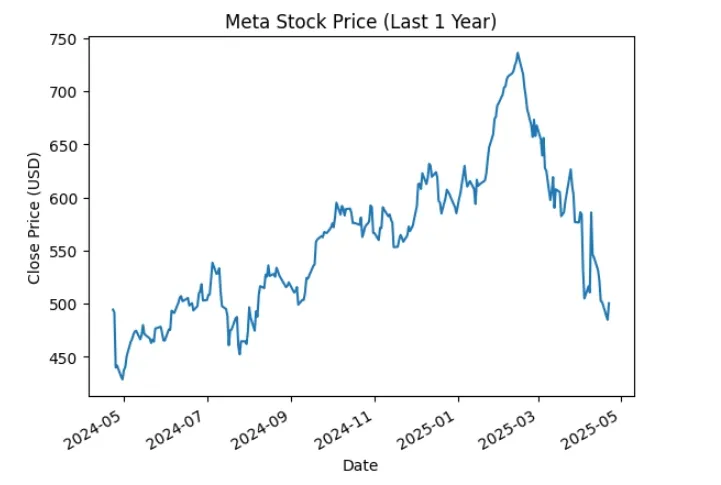
**Example 7: Visualize Data and Display in Tabular Format
We can visualize the closing prices using matplotlib library.
Python `
import matplotlib.pyplot as plt import yfinance as yf meta = yf.Ticker("META") data = meta.history(period="1y") print(data.to_string()) data['Close'].plot(title="Meta Stock Price (Last 1 Year)") plt.xlabel("Date") plt.ylabel("Close Price (USD)") plt.show()
`
**Output:
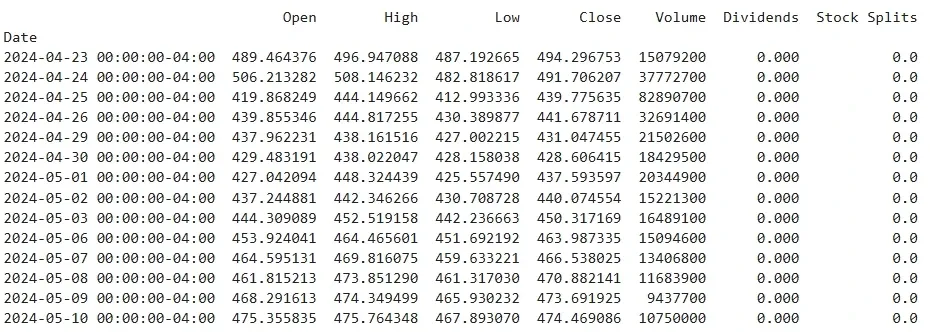
META history of 1 year
META Stock data
Whether we are tracking stock prices, analyzing market trends or finding company financials these methods will provide us flexibility and tools need to perform in-depth analysis and valuable insights.