Grouping and Aggregating with Pandas (original) (raw)
Last Updated : 26 Jul, 2025
When working with large datasets it's used to group and summarize the data to make analysis easier. Pandas a popular Python library provides powerful tools for this. In this article you'll learn how to use Pandas' groupby() and **aggregation functions step by step with clear explanations and practical examples.
Aggregation in Pandas
Aggregation means applying a mathematical function to summarize data. It can be used to get a summary of columns in our dataset like getting sum, minimum, maximum etc. from a particular column of our dataset. The function used for aggregation is **agg() the parameter is the function we want to perform. Some functions used in the aggregation are:
| Function | Description |
|---|---|
| sum() | Compute sum of column values |
| min() | Compute min of column values |
| max() | Compute max of column values |
| mean() | Compute mean of column |
| size() | Compute column sizes |
| describe() | Generates descriptive statistics |
| first() | Compute first of group values |
| last() | Compute last of group values |
| count() | Compute count of column values |
| std() | Standard deviation of column |
| var() | Compute variance of column |
| sem() | Standard error of the mean of column |
Creating a Sample Dataset
Let's create a small dataset of student marks in Maths, English, Science and History.
Python `
import pandas as pd
df = pd.DataFrame([[9, 4, 8, 9], [8, 10, 7, 6], [7, 6, 8, 5]], columns=['Maths', 'English', 'Science', 'History'])
print(df)
`
**Output:
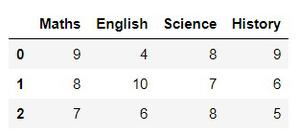
Now that we have a dataset let’s perform aggregation.
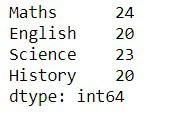
1. Summing Up All Values (sum())
The sum() function adds up all values in each column.
Python `
df.sum()
`
**Output:
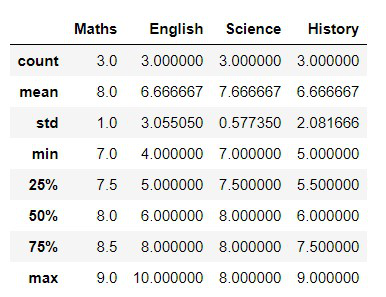
2. Getting a Summary (describe())
Instead of calculating sum, mean, min and max separately we can use describe() which provides all important statistics in one go.
Python `
df.describe()
`
**Output:
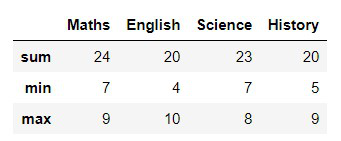
3. Applying Multiple Aggregations at Once (agg())
The .agg() function lets you apply multiple aggregation functions at the same time.
Python `
df.agg(['sum', 'min', 'max'])
`
**Output:
Grouping in Pandas
Grouping in Pandas means organizing your data into groups based on some columns. Once grouped you can perform actions like finding the total, average, count or even pick the first row from each group. This method follows a **split-apply-combine process:
- **Split the data into groups
- **Apply some calculation like sum, average etc.
- **Combine the results into a new table.
Let’s understand grouping in Pandas using a small bakery order dataset as an example.
Python `
import pandas as pd
data = { 'Item': ['Cake', 'Cake', 'Bread', 'Pastry', 'Cake'], 'Flavor': ['Chocolate', 'Vanilla', 'Whole Wheat', 'Strawberry', 'Chocolate'], 'Price': [250, 220, 80, 120, 250] }
df = pd.DataFrame(data) print(df)
`
**Output:

Bakery dataset
1. Grouping Data by One Column Using groupby()
Let’s say we want to group the orders based on the Item column.
Python `
grouped = df.groupby('Item') print(grouped)
`
**Output:
<pandas.core.groupby.generic.DataFrameGroupBy object at 0x7867484be150>
This doesn't show the result directly it just creates a **grouped object. To actually see the data we need to apply a method like .sum(), .mean() or first(). Let’s find the **total price of each item sold:
Python `
print(df.groupby('Item')['Price'].sum())
`
**Output:

Grouping data by one columns
The above output shows the total earnings from each item.
2. Grouping by Multiple Columns
Now let’s group by **Item and Flavor to see how each flavored item sold.
Python `
print(df.groupby(['Item', 'Flavor'])['Price'].sum())
`
**Output:

Grouping by multiple columns
The above output show Chocolate Cakes earned ₹500 and Vanilla Cake earned ₹220 and more.
Which of the following methods is used to group data before applying aggregation functions like sum() or mean() in Pandas?
- df.group()
- df.aggregate()
- df.groupby()
- df.group_by()
Explanation:
The .groupby() method is used to group data based on one or more columns, after which aggregation functions (like mean(), sum()) can be applied.
What does the following code do?
print("GFG")
df.groupby('Category')['Price'].mean()
- Groups data by 'Category' and finds the mean of 'Price' for each category
- Groups data by 'Price' and calculates the mean for 'Category'
- Filters data based on the 'Price' column
- Creates a new column 'mean_price' in the DataFrame
Explanation:
This groups data by 'Category' and calculates the average of 'Price' for each unique 'Category'.
How would you get the sum of 'Sales' for each 'Region' in a DataFrame df?
- df.groupby('Region')['Sales'].sum()
- df['Sales'].groupby('Region').sum()
- df.groupby('Region').sum()['Sales']
- Both a and c
Explanation:
Both approaches group by 'Region' and sum the 'Sales' column. The second one involves chaining .sum() to the grouped DataFrame.

Quiz Completed Successfully
Your Score : 2/3
Accuracy : 0%
Login to View Explanation
1/3
1/3 < Previous Next >