Histogram in Pygal (original) (raw)
Last Updated : 28 Jul, 2020
Pygal is a Python module that is mainly used to build SVG (Scalar Vector Graphics) graphs and charts. SVG is a vector-based graphics in the XML format that can be edited in any editor. Pygal can create graphs with minimal lines of code that can be easy to understand and write.
Histogram
The histogram is a graphical display of data using bars of different heights, it is similar to bar chart but the histogram presents the number of groups into ranges and presents them in segment columns. Histogram chart is only used for plotting the frequency of score occurrences in a continuous data set that has been divided into classes, called bins. Histogram are those type of special bars which take 3 values for a bar:
- The ordinate height
- The abscissa start
- The abscissa end
Syntax:
hist = pygal.Histogram()
Example 1:
Python3 1== `
importing pygal
import pygal import numpy
creating the chart object
histogram = pygal.Histogram()
naming the title
histogram.title = 'Stacked Bar Chart'
Random data
for i in range(5, 20, 10): data = list(zip(numpy.random.rand(i), numpy.random.rand(3), numpy.random.rand(i))) histogram.add(str(i), data)
histogram
`
Output: 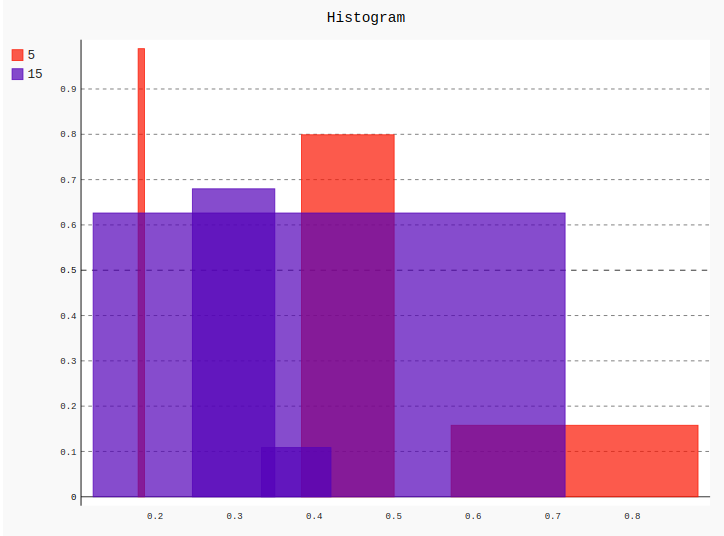 Example 2:
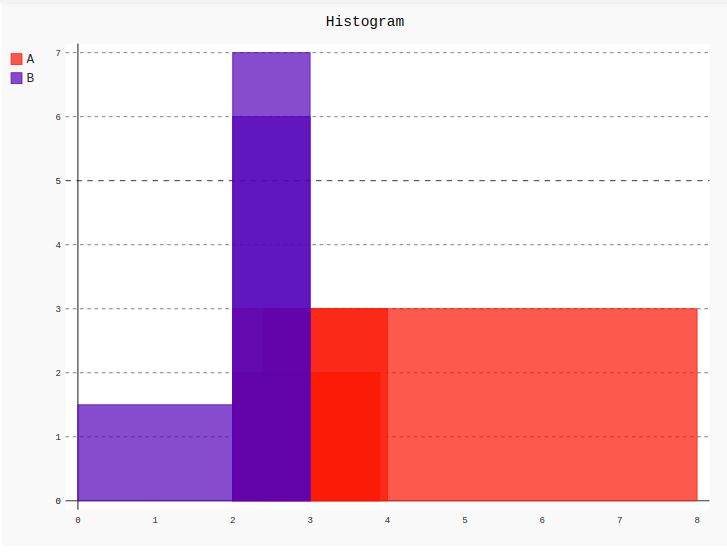
Python3 1== `
importing pygal
import pygal import numpy
creating the chart object
histogram = pygal.Histogram()
naming the title
histogram.title = 'Histogram'
histogram.add('A', [(2, 2, 3.9), (3, 2, 8), (3, 4, 2.4)]) histogram.add('B', [(1.5, 0, 2), (6, 2, 3), (7, 3, 2)])
histogram
`
Output: