How to Automate an Excel Sheet in Python? (original) (raw)
Last Updated : 12 Sep, 2025
Python provides **openpyxl library using which you can automate Excel tasks programmatically. It allows you to read, write, edit, and format spreadsheets, apply formulas, and even generate charts directly from Python scripts saving both time and effort.
Installing Required Library
Install it using the following command:
pip install openpyxl
Example
- We have an Excel sheet with product data:
Column 3 → Prices (but they’re incorrect). - We need to
1. Decrease each price by 10%
2.Save corrected prices in Column 4
3. Add a bar chart of the corrected prices
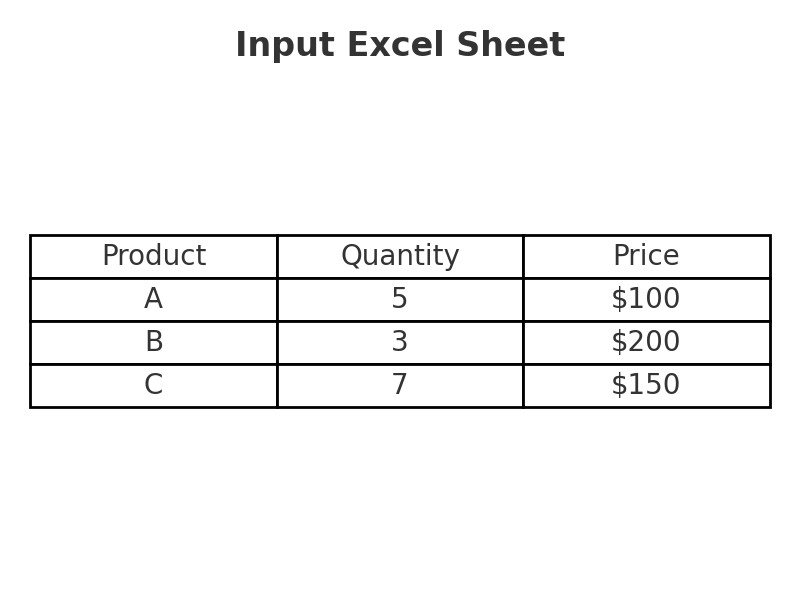
input.png
Doing this manually for thousands of rows would take days - let's see how we can automate this using Python's **openpyxl library:
1. Import Libraries
Python `
import openpyxl as xl from openpyxl.chart import BarChart, Reference
`
- **openpyxl: Work with Excel.
- **Bar Chart, Reference: Used to create charts.
2. Open Workbook & Sheet
Python `
#loads the Excel file python-spreadsheet.xlsx and picks the worksheet "Sheet1" from it. wb = xl.load_workbook("python-spreadsheet.xlsx") sheet = wb["Sheet1"]
`
3. Loop Through Rows
Python `
#Iterating the sheet using for loop for row in range(2, sheet.max_row + 1): cell = sheet.cell(row, 3)
`
4. Correct the Prices
Python `
corrected_price = float(cell.value.replace('$', '')) * 0.9 sheet.cell(row, 4).value = corrected_price
`
- Removes the $ sign, converts value to number.
- multiplies by 0.9 (10% discount)
- writes corrected price in Column 4.
5. Add a Chart
Python `
values = Reference(sheet, min_row=2, max_row=sheet.max_row, min_col=4, max_col=4) chart = BarChart() chart.add_data(values) sheet.add_chart(chart, "E2")
`
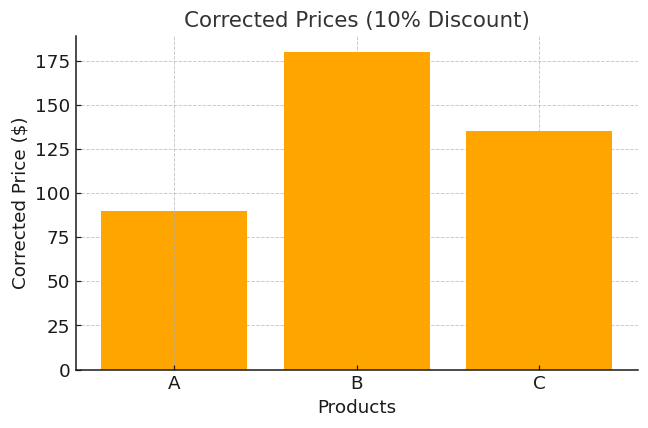
chart
- Selects corrected prices (Column 4).
- Creates a bar chart and places it at cell E2.
6. Save the File
Python `
#Saves everything into a new file so original data isn’t lost. wb.save("python-spreadsheet2.xlsx")
`
7. Making It Reusable
If you want to process many spreadsheets, put the logic into a function:
Python `
def process_workbook(filename): wb = xl.load_workbook(filename) sheet = wb["Sheet1"]
for row in range(2, sheet.max_row + 1):
    cell = sheet.cell(row, 3)
    corrected_price = float(cell.value.replace('$', '')) * 0.9
    sheet.cell(row, 4).value = corrected_price

values = Reference(sheet, min_row=2, max_row=sheet.max_row, min_col=4, max_col=4)
chart = BarChart()
chart.add_data(values)
sheet.add_chart(chart, "E2")

wb.save(filename)
`
Now you can run:
Python `
process_workbook("python-spreadsheet.xlsx")
`
**Output
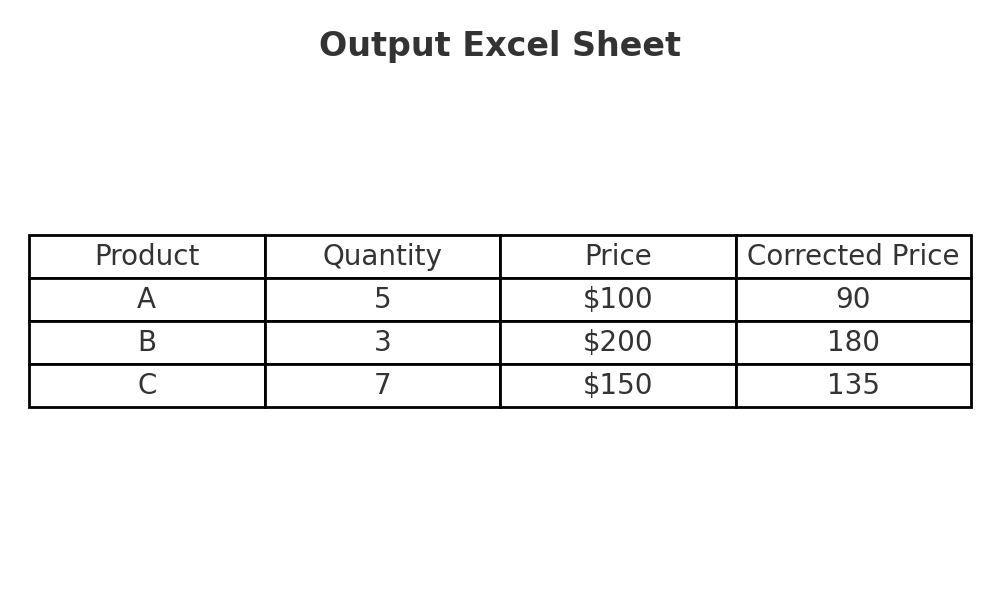
output.png
Complete Code
Python `
import openpyxl as xl from openpyxl.chart import BarChart, Reference
Load workbook & select sheet
wb = xl.load_workbook("python-spreadsheet.xlsx") sheet = wb["Sheet1"]
Loop through rows (starting from 2 to skip header)
for row in range(2, sheet.max_row + 1): cell = sheet.cell(row, 3) # Price column corrected_price = float(cell.value.replace('$', '')) * 0.9 sheet.cell(row, 4).value = corrected_price # Write to new column
Select corrected prices (Column 4) for chart
values = Reference(sheet, min_row=2, max_row=sheet.max_row, min_col=4, max_col=4)
Create bar chart
chart = BarChart() chart.add_data(values) sheet.add_chart(chart, "E2") # Place chart at cell E2
Save updated file
wb.save("python-spreadsheet2.xlsx")
`