How to Calculate Rolling Correlation in Python? (original) (raw)
Last Updated : 29 Jan, 2022
Correlation generally determines the relationship between two variables. The rolling correlation measure the correlation between two-time series data on a rolling window Rolling correlation can be applied to a specific window width to determine short-term correlations.
Calculating Rolling Correlation in Python
Let's use sales data of two products A and B in the last 60 months to calculate the rolling correlation. Pandas package provides a function called rolling.corr() to calculate the rolling correlation.
Syntax:
data1.rolling(width).corr(data2)
Where,
- data1, data2 - data/column of interest (type series)
- width - Rolling window width (int)
Note: The width of the rolling window should be 3 or greater in order to calculate correlations.
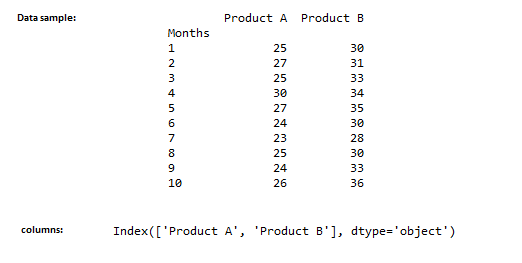
Data Used:
Python3 `
import pandas module
import pandas as pd
read the data
data = pd.read_csv('product_sales.csv')
display top 10 rows
print(data.head(10))
display column names
print(data.columns)
`
Output:
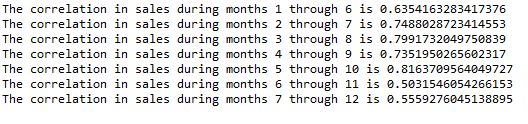
Example 2:
Here, we used the window width of 6, which shows the successive 6 months rolling correlation. We could see a significant correlation between two products sales any sudden dip or rise in correlation signals an unusual event, that caused the dip.
Python3 `
data['Product A'].rolling(6).corr(data['Product B'])
formatting the output
k = 1
for i, j in enumerate(data['Product A'].rolling(6).corr(data['Product B'])):
if (i >= 5 and i < 12):
print(f'The correlation in sales during months
{k} through {i+1} is {j}')
i = 0
k += 1
`
Output:
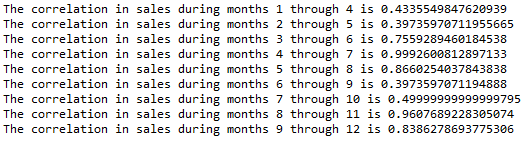
Now's let us try the same for 3-month correlation as shown below,
Example 3:
Python3 `
data['Product A'].rolling(3).corr(data['Product B'])
formatting the output
k = 1
for i, j in enumerate(data['Product A'].rolling(3).corr(data['Product B'])):
if (i >= 3 and i < 12):
print(
f'The correlation in sales during months {k}
through {i+1} is {j}')
i = 0
k += 1
`
Output: