How to change legend box size in Pygal? (original) (raw)
Last Updated : 23 Jul, 2025
Prerequisites: pygal
Pygal is a Python module that is mainly used to build SVG (Scalar Vector Graphics) graphs and charts. Pygal is a graphics and user interface library for Python that provides functionality commonly required in designing and science applications.
In this article, we will see how we can change the legend Box size by just changing its integer value. While making a chart, It is important to pass the legend box size correctly so it looks optimized in size and position.
Approach
- Import required module.
- Create a chart object.
- Pass legend box size in the same function.
- Label the graph.
- Display Graph.
Implementation of the concept discussed above is given below:
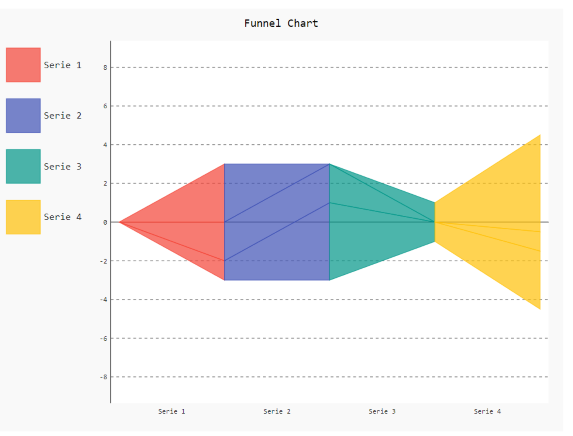
Example 1:
Python3 `
importing pygal
import pygal import numpy
creating the chart object
Resize legend box size
chart = pygal.Funnel(legend_box_size=48)
Random data
chart.add('Serie 1', [1, 2, 3]) chart.add('Serie 2', [4, 2, 0]) chart.add('Serie 3', [1, -1, 1]) chart.add('Serie 4', [3, 1, 5])
naming the title
chart.title = 'Funnel Chart'
chart.render_to_png('aa.png')
`
Output
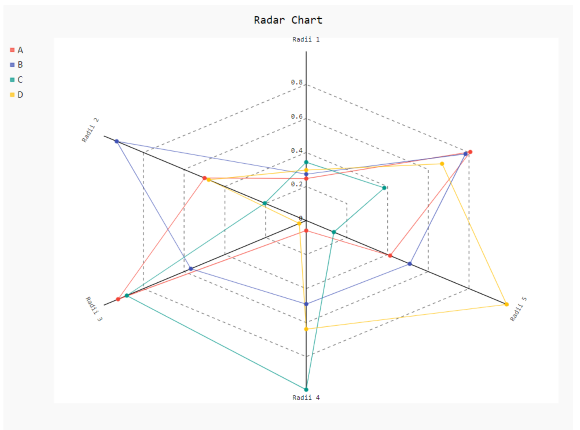
Example 2:
Python3 `
importing pygal
import pygal import numpy
creating the chart object
Resize legend box size
Radar_Chart = pygal.Radar(legend_box_size=5)
Radar_Chart.x_labels = ['Radii 1', 'Radii 2', 'Radii 3', 'Radii 4', 'Radii 5']
Random data
Radar_Chart.add('A', numpy.random.rand(6)) Radar_Chart.add('B', numpy.random.rand(6)) Radar_Chart.add('C', numpy.random.rand(6)) Radar_Chart.add('D', numpy.random.rand(6))
naming the title
Radar_Chart.title = 'Radar Chart'
Radar_Chart.render_to_png('aa.png')
`
Output