How to Create a Correlation Matrix using Pandas? (original) (raw)
**Correlation Matrix is a statistical technique used to measure the relationship between two variables. Using Pandas, you can easily generate a correlation matrix to understand how features relate whether they move together, in opposite directions, or show no clear trend. Let’s explore various effective methods to create a correlation matrix using Pandas, NumPy and SciPy.
Using DataFrame.corr()
This method computes the Pearson correlation coefficient, measuring the linear relationship between columns. Values range from -1 (perfect negative correlation) to 1 (perfect positive correlation), with 0 indicating no linear relationship. The diagonal is always 1 because each column perfectly correlates with itself.
Python `
import pandas as pd df = pd.DataFrame({ 'A': [1, 2, 3, 4, 5], 'B': [5, 4, 3, 2, 1], 'C': [2, 3, 2, 3, 2] })
res = df.corr() print(res)
`
Output
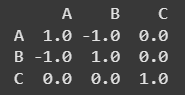
A B CA 1.0 -1.0 0.0 B -1.0 1.0 0.0 C 0.0 0.0 1.0
**Explanation: Columns **A and B have a perfect negative correlation (-1) because as A increases, B decreases. Column **C shows no linear correlation with others, indicated by values near 0.
Using DataFrame.corr(method='spearman') or 'kendall'
These compute rank-based correlations instead of using raw values. Spearman measures how well a monotonic relationship fits (useful for non-linear but consistent trends), while Kendall compares data orderings differently. Both work well with non-linear or ordinal data.
Python `
import pandas as pd df = pd.DataFrame({ 'X': [10, 20, 30, 40, 50], 'Y': [50, 40, 30, 20, 10], 'Z': [5, 7, 6, 8, 7] })
Spearman correlation matrix
a = df.corr(method='spearman') print(a)
Kendall correlation matrix
b = df.corr(method='kendall') print(b)
`
**Output
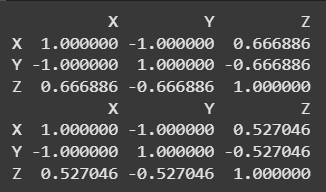
Using DataFrame.corr(method='spearman') or 'kendall'
**Explanation: X and **Y have a perfect negative correlation (-1). Z shows moderate positive correlation with X and moderate negative with Y, reflecting consistent but not perfect monotonic relationships in both Spearman and Kendall matrices.
Using numpy.corrcoef()
Calculates the Pearson correlation matrix directly on NumPy arrays. It’s fast but doesn’t handle labels, you’d convert results back to a DataFrame for clarity.
Python `
import numpy as np import pandas as pd df = pd.DataFrame({ 'M': [7, 9, 5, 8, 6], 'N': [1, 2, 3, 4, 5], 'O': [10, 9, 8, 7, 6] })
a = np.corrcoef(df.values.T) b = pd.DataFrame(a, index=df.columns, columns=df.columns) print(b)
`
**Output
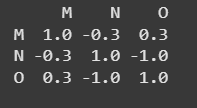
Using numpy.corrcoef()
**Explanation: M and **N have a weak negative correlation, M and **O show moderate positive correlation and **N and **O have a strong negative correlation. The matrix reflects these varying linear relationships.
Using scipy.stats.pearsonr
Computes Pearson correlation for each pair of columns individually, returning both the coefficient and a p-value for significance. Offers detailed stats but requires manual looping over pairs.
Python `
import pandas as pd from scipy.stats import pearsonr df = pd.DataFrame({ 'A': [1, 2, 3, 4, 5], 'B': [5, 4, 3, 2, 1], 'C': [2, 3, 2, 3, 2] })
a = pd.DataFrame(index=df.columns, columns=df.columns) for c1 in df.columns: for c2 in df.columns: corr, _ = pearsonr(df[c1], df[c2]) a.loc[c1, c2] = corr
b = a.astype(float) print(b)
`
**Output
Using scipy.stats.pearsonr
**Explanation: A and **B have a perfect negative correlation (-1), reflecting their opposite linear trends. **A and **C, as well as **B and C, show no correlation (0), indicating no linear relationship. The matrix clearly captures these relationships between the variables.
**Related articles: