How to Create a Poisson Probability Mass Function Plot in Python? (original) (raw)
Last Updated : 23 Jul, 2025
In this article, we will see how we can create a Poisson probability mass function plot in Python. In probability theory and statistics, the Poisson distribution is a discrete probability distribution that expresses the probability of a given number of events occurring in a fixed interval of time or space if these events occur with a known constant mean rate and independently of the time since the last event. The Poisson distribution can also be used for the number of events in other specified intervals such as distance, area or volume.
In order to plot the Poisson distribution, we will use scipy module. **SciPy is a free and open-source Python library used for scientific computing and technical computing. SciPy contains modules for optimization, linear algebra, integration, interpolation, special functions, FFT, signal and image processing, ODE solvers and other tasks common in science and engineering.
In order to get the poisson probability mass function plot in python we use scipy's poisson.pmf method.
**Syntax : poisson.pmf(k, mu, loc)
**Argument : It takes numpy array, shape parameter and location as argument
**Return : It returns numpy array
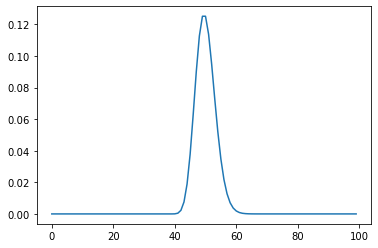
**Example 1:
Python3 `
importing poisson from scipy
from scipy.stats import poisson
importing numpy as np
import numpy as np
importing matplotlib as plt
import matplotlib.pyplot as plt
creating a numpy array for x-axis
x = np.arange(0, 100, 0.5)
poisson distribution data for y-axis
y = poisson.pmf(x, mu=40, loc=10)
plotting the graph
plt.plot(x, y)
showing the graph
plt.show()
`
**Output :
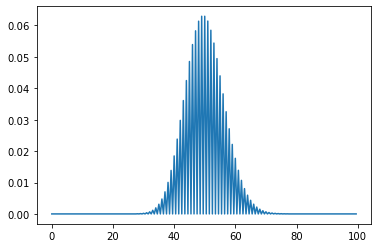
**Example 2: Using step size of data as 1
Python3 `
importing poisson from scipy
from scipy.stats import poisson
importing numpy as np
import numpy as np
importing matplotlib as plt
import matplotlib.pyplot as plt
creating a numpy array for x-axis
using step size as 1
x = np.arange(0, 100, 1)
poisson distribution data for y-axis
y = poisson.pmf(x, mu=10, loc=40)
plotting the graph
plt.plot(x, y)
showing the graph
plt.show()
`
**Output:
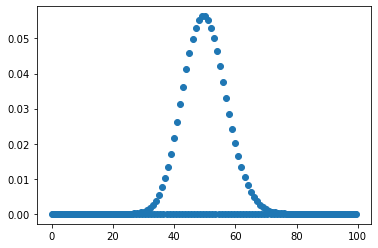
**Example 3: Plotting scatterplot for better viewing of data points
Python3 `
importing poisson from scipy
from scipy.stats import poisson
importing numpy as np
import numpy as np
importing matplotlib as plt
import matplotlib.pyplot as plt
creating a numpy array for x-axis
x = np.arange(0, 100, 0.5)
poisson distribution data for y-axis
y = poisson.pmf(x, mu=50, loc=0)
plotting thescatter plot graph
plt.scatter(x, y)
showing the graph
plt.show()
`
**Output: