How to show or hide labels in Pygal? (original) (raw)
Last Updated : 23 Jul, 2025
Prerequisites: pygal
Pygal is a graphics and user interface library for Python that provides functionality commonly required in designing and science applications. While making a plot it is important for us to optimize its label, title, size. In this article, we will see how we can show/hide the label value of the plot window in the Pygal module. Here are various ways to change the default show/hide labels as per our requirement.
Approach:
- Import required module.
- Create a chart object.
- Show or hide label value.
- Label the graph.
- Display Graph.
Implementation of the concept discussed above is given below**:**
Example 1:
Python3 `
import library
import pygal import numpy
creating the chart object
enable/disable labels
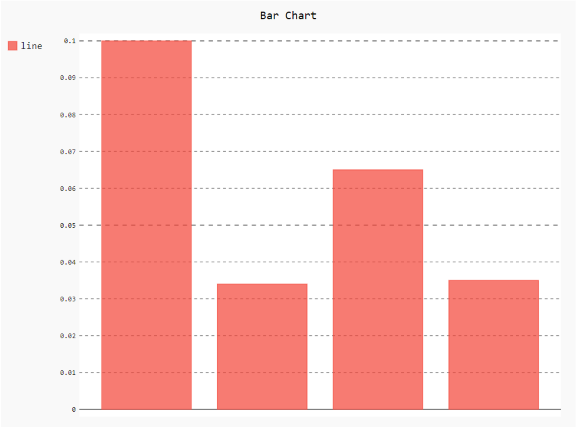
chart = pygal.Bar(show_x_labels=False)
Random data
chart.x_labels = [ 'First Bar !', 'Second Bar !', 'Third Bar !', 'Fourth Bar !'] chart.add('line', [0.1, .034, .065, .035])
naming the title
chart.title = 'Bar Chart'
chart.render_to_png('aa.png')
`
Output
Example 2:
Python3 `
import library
import pygal
enable/disable labels
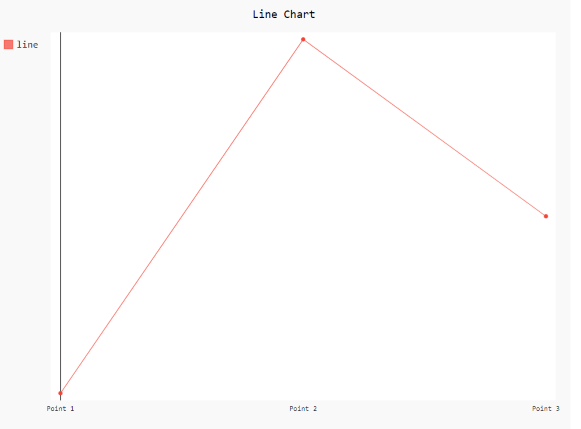
chart = pygal.Line(show_y_labels=False, show_x_labels=True)
X-label
chart.x_labels = 'Point 1', 'Point 2', 'Point 3'
y-label
chart.add('line', [.0002, .0005, .00035])
naming the title
chart.title = 'Line Chart'
chart.render_to_png('aa.png')
`
Output
Example 3:
Python3 `
import library
import pygal import numpy
creating the chart object
enable/disable labels
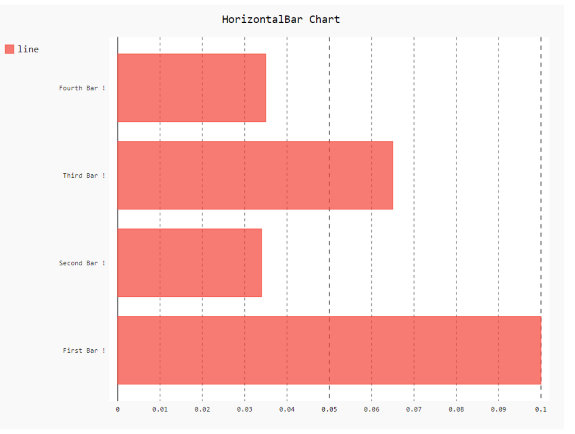
chart = pygal.HorizontalBar(show_x_labels=True, show_y_labels=True)
Random data
chart.x_labels = [ 'First Bar !', 'Second Bar !', 'Third Bar !', 'Fourth Bar !'] chart.add('line', [0.1, .034, .065, .035])
naming the title
chart.title = 'HorizontalBar Chart'
chart.render_to_png('aa.png')
`
Output