Introduction to Graphs in Python (original) (raw)
Last Updated : 23 Jul, 2025
**Graph is a non-linear data structure consisting of vertices and edges. The vertices are sometimes also referred to as nodes and the edges are lines or arcs that connect any two nodes in the graph. More formally a Graph is composed of a set of vertices( **V ) and a set of edges( **E ). The graph is denoted by **G(V, E).
Imagine a game of football as a web of connections, where players are the nodes and their interactions on the field are the edges. This web of connections is exactly what a graph data structure represents, and it’s the key to unlocking insights into team performance and player dynamics in sports.

Introduction to Graphs
Components of Graph Data Structure
- **Vertices: Vertices are the fundamental units of the graph. Sometimes, vertices are also known as vertex or nodes. Every node/vertex can be labeled or unlabelled.
- **Edges: Edges are drawn or used to connect two nodes of the graph. It can be ordered pair of nodes in a directed graph. Edges can connect any two nodes in any possible way. There are no rules. Sometimes, edges are also known as arcs. Every edge can be labelled/unlabelled.
explore in detail about - Types of Graphs in Data Structures and Algorithms
Representation of Graph Data Structure
There are multiple ways to store a graph, following are the most common representations:
- Adjacency Matrix Representation
- Adjacency List Representation
Adjacency Matrix Representation of Graph Data Structure
In this method, the graph is stored in the form of the 2D matrix where rows and columns denote vertices. Each entry in the matrix represents the weight of the edge between those vertices.
-copy.webp)
Below is the Python implementation of Graph Data Structure represented using Adjacency Matrix:
Python `
def add_edge(mat, i, j):
# Add an edge between two vertices
mat[i][j] = 1  # Graph is
mat[j][i] = 1  # Undirected
def display_matrix(mat):
# Display the adjacency matrix
for row in mat:
    print(" ".join(map(str, row)))
Main function to run the program
if name == "main": V = 4 # Number of vertices mat = [[0] * V for _ in range(V)]
# Add edges to the graph
add_edge(mat, 0, 1)
add_edge(mat, 0, 2)
add_edge(mat, 1, 2)
add_edge(mat, 2, 3)

# Optionally, initialize matrix directly
"""
mat = [
    [0, 1, 0, 0],
    [1, 0, 1, 0],
    [0, 1, 0, 1],
    [0, 0, 1, 0]
]
"""

# Display adjacency matrix
print("Adjacency Matrix:")
display_matrix(mat)
`
Output
Adjacency Matrix: 0 1 1 0 1 0 1 0 1 1 0 1 0 0 1 0
Explore in detail about - Adjacency Matrix Representation
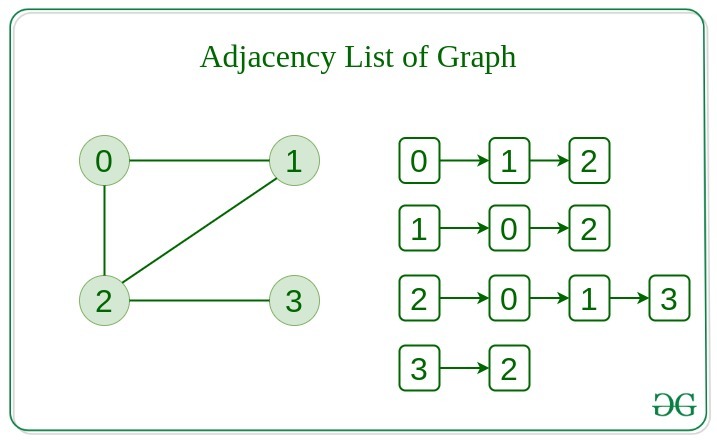
Adjacency List Representation of Graph
This graph is represented as a collection of linked lists. There is an array of pointer which points to the edges connected to that vertex.
Below is the Python implementation of Graph Data Structure represented using Adjacency List:
Python `
def add_edge(adj, i, j): adj[i].append(j) adj[j].append(i) # Undirected
def display_adj_list(adj): for i in range(len(adj)): print(f"{i}: ", end="") for j in adj[i]: print(j, end=" ") print()
Create a graph with 4 vertices and no edges
V = 4 adj = [[] for _ in range(V)]
Now add edges one by one
add_edge(adj, 0, 1) add_edge(adj, 0, 2) add_edge(adj, 1, 2) add_edge(adj, 2, 3)
print("Adjacency List Representation:") display_adj_list(adj)
`