Jaccard Similarity (original) (raw)
Measuring similarity between datasets is a fundamental problem in many fields, such as natural language processing, machine learning, and recommendation systems. One of the simplest and most effective similarity measures is Jaccard similarity, which quantifies how much two sets overlap.
Jaccard similarity, also known as the Jaccard index or Jaccard coefficient, is a measure of similarity between two sets. It is defined as the ratio of the intersection of the sets to their union:
J(A, B) = \frac{|A \cap B|}{|A \cup B|}
where:
- ∣A∩B∣ is the number of common elements between sets
- ∣A∪B∣ is the total number of unique elements in both sets.
The value of Jaccard similarity ranges from 0 to 1:
- J(A,B)=1 → The sets are identical.
- J(A,B)=0 → The sets have no common elements.
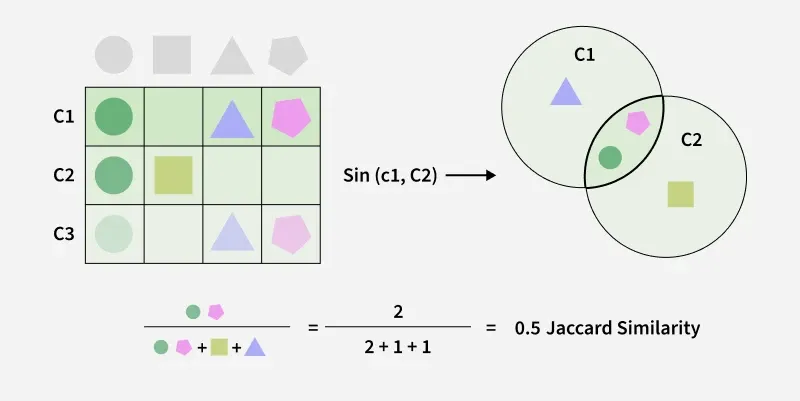
Computing similarity between two objects using Jaccard similarity
Jaccard Similarity Between Two Binary Vectors
Formula for Binary Vectors
For two binary vectors, Jaccard similarity is computed as:
J(A, B) = \frac{M_{11}}{M_{01} + M_{10} + M_{11}}
where:
- M11 → Number of positions where both vectors have 1.
- M10 → Positions where A has 1 and B has 0.
- M01 → Positions where A has 0 and B has 1.
Numerical Example
Consider the binary vectors:
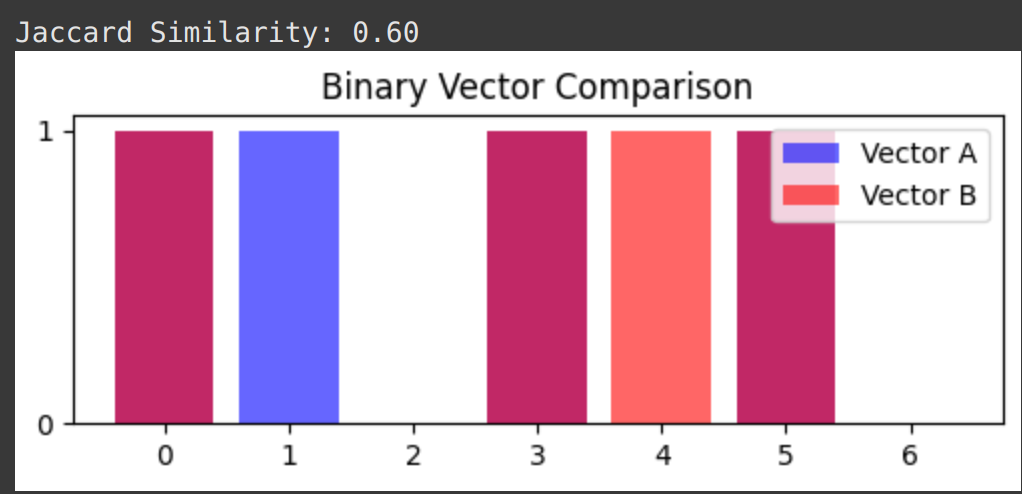
A = [1, 1, 0, 1, 0, 1, 0]
B = [1, 0, 0, 1, 1, 1, 0]
Step-by-step calculations:
- M11 = 3 (positions: 1st, 4th, 6th)
- M10 = 1 (position: 2nd)
- M01 = 1 (position: 5th)
J(A, B) = \frac{3}{3 + 1 + 1} = \frac{3}{5} = 0.6
Python Implementation with Visualization
Python `
import numpy as np import matplotlib.pyplot as plt from sklearn.metrics import jaccard_score
Define two binary vectors
A = np.array([1, 1, 0, 1, 0, 1, 0]) B = np.array([1, 0, 0, 1, 1, 1, 0])
Compute Jaccard Similarity
similarity = jaccard_score(A, B)
Print result
print(f"Jaccard Similarity: {similarity:.2f}")
Visualization
plt.figure(figsize=(6, 2)) plt.bar(range(len(A)), A, color='blue', alpha=0.6, label="Vector A") plt.bar(range(len(B)), B, color='red', alpha=0.6, label="Vector B") plt.xticks(range(len(A))) plt.yticks([0, 1]) plt.legend() plt.title("Binary Vector Comparison") plt.show()
`
Output:
Jaccard Similarity Between Two Sets
Formula for Sets
For two sets 𝐴 and 𝐵, the Jaccard similarity is:
J(A, B) = \frac{|A \cap B|}{|A \cup B|}
Numerical Example
Consider the binary vectors:
A = {1, 2, 3, 4, 5}
𝐵 = {3, 4, 5, 6, 7}
Step-by-step calculations:
- A∩B={3,4,5} → Intersection (common elements)
- A∪B={1,2,3,4,5,6,7} → Union (total unique elements)
J(A, B) = \frac{3}{7} \approx 0.428
Python Implementation with Visualization
Python `
import matplotlib.pyplot as plt from matplotlib_venn import venn2
Define two sets
A = {1, 2, 3, 4, 5} B = {3, 4, 5, 6, 7}
Compute Jaccard Similarity
jaccard_sim = len(A & B) / len(A | B)
Print result
print(f"Jaccard Similarity: {jaccard_sim:.2f}")
Visualization using Venn diagram
plt.figure(figsize=(4, 4)) venn = venn2([A, B], set_labels=('A', 'B'))
Customize colors
venn.get_label_by_id('10').set_color('blue') venn.get_label_by_id('01').set_color('red') venn.get_label_by_id('11').set_color('purple')
Title
plt.title("Venn Diagram Representation") plt.show()
`