Plotting Sine and Cosine Graph using Matplotlib in Python (original) (raw)
Last Updated : 23 Jul, 2025
Data visualization and Plotting is an essential skill that allows us to spot trends in data and outliers. With the help of plots, we can easily discover and present useful information about the data. In this article, we are going to plot a sine and cosine graph using Matplotlib in Python. Matplotlib is a Python library for data visualization and plotting, if you don't have Matplotlib installed on your system, please install it before Plotting Sine and Cosine Graph using Matplotlib. One can install Matplotlib using the below command on the terminal or Jupyter notebook.
pip install matplotlib
Plotting Sine Graph using Matplotlib in Python
Now let's plot the sine curve using the sine function that is inbuilt into the NumPy library and plot it using Matplotlib.
**Step 1: Import the necessary library for plotting.
Python `
#Importing required library import numpy as np import matplotlib.pyplot as plt
`
**Step 2: Create a list or load your own data for Plotting Sine Graph.
Python `
Creating x axis with range and y axis with Sine
Function for Plotting Sine Graph
x = np.arange(0, 5*np.pi, 0.1) y = np.sin(x)
`
**Step 3: Plotting Sine Graph with the created list or load data.
Python `
Plotting Sine Graph
plt.plot(x, y, color='green') plt.show()
`
**Output:
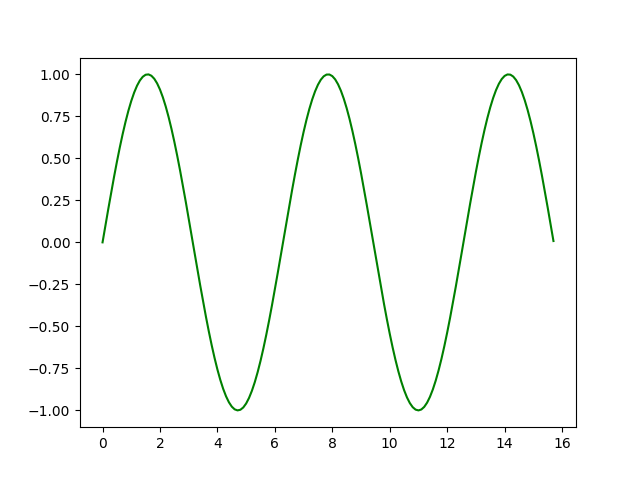
Sine Curve using Matplotlib
Plotting Cosine Graph using Matplotlib in Python
Now let's plot the cosine curve using the cosine function that is inbuilt into the NumPy library and plot it using Matplotlib.
Python `
Importing required library
import numpy as np import matplotlib.pyplot as plt
Creating x axis with range and y axis with Sine
Function for Plotting Cosine Graph
x = np.arange(0, 5*np.pi, 0.1) y = np.cos(x)
Plotting coine Graph
plt.plot(x, y, color='green') plt.show()
`
**Output:
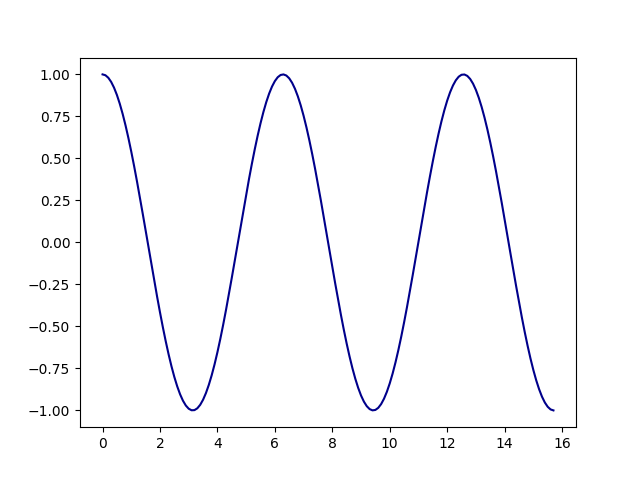
Cosine Curve using Matplotlib
Plotting Both Combined Sine and Cosine Graph
From the above two curves, one must think that both of them seem pretty similar. Let's look at both of these curves on the same graph then we will be able to detect the difference between the graph of the two curves.
Python `
Importing required library
import numpy as np import matplotlib.pyplot as plt
Creating x axis with range and y axis
Function for Plotting Sine and Cosine Graph
x = np.arange(0, 5*np.pi, 0.1) y1 = np.sin(x) y2 = np.cos(x)
Plotting Sine Graph
plt.plot(x, y1, color='green') plt.plot(x, y2, color='darkblue') plt.show()
`
**Output:

Sine and Cosine Curve using Matplotlib
Plotting different waveforms using Numpy and Matplotlib:
The sine wave, square wave, triangle wave, and sawtooth wave are four different waveforms that are created and displayed. These waveforms are frequently utilized in signal processing, electronics, and several scientific and technical applications.
Code:
Python `
import numpy as np import matplotlib.pyplot as plt
Define signal parameters
T = 1 # period (seconds) fs = 1000 # sampling frequency (Hz) time = np.linspace(0, T, T * fs, endpoint=False)
Generate sine wave
frequency_sine = 5 # frequency (Hz) sine_wave = np.sin(2 * np.pi * frequency_sine * time)
Generate square wave
frequency_square = 2 # frequency (Hz) duty_cycle = 0.01 # percentage of the period where the signal is high square_wave = np.where( np.mod(np.floor(2 * duty_cycle * fs * time), 2) == 0, 1, -1)
Generate triangle wave
frequency_triangle = 1 # frequency (Hz) triangle_wave = 2 * np.abs((10 * frequency_triangle * time) % 2 - 1) - 1
Generate sawtooth wave
frequency_sawtooth = 10 # frequency (Hz) sawtooth_wave = 2 * (frequency_sawtooth * time - np.floor(frequency_sawtooth * time + 0.5))
Plot the waves
fig, axs = plt.subplots(4, 1, sharex=True, figsize=(8, 8)) axs[0].plot(time, sine_wave) axs[0].set_title('Sine Wave') axs[1].plot(time, square_wave) axs[1].set_title('Square Wave') axs[2].plot(time, triangle_wave) axs[2].set_title('Triangle Wave') axs[3].plot(time, sawtooth_wave) axs[3].set_title('Sawtooth Wave') plt.xlabel('Time (s)') plt.show()
`
Output:
