Statistics with Python (original) (raw)
**Statistics, in general, is the method of collection of data, tabulation, and interpretation of numerical data. It is an area of applied mathematics concerned with data collection analysis, interpretation, and presentation. With statistics, we can see how data can be used to solve complex problems.
In this tutorial, we will learn about solving statistical problems with Python and will also learn the concept behind it. Let's start by understanding some concepts that will be useful throughout the article.
**Note: We will be covering descriptive statistics with the help of the statistics module provided by Python.
Understanding the Descriptive Statistics
In layman's terms, descriptive statistics generally means describing the data with the help of some representative methods like charts, tables, Excel files, etc. The data is described in such a way that it can express some meaningful information that can also be used to find some future trends. Describing and summarizing a single variable is called **univariate analysis. Describing a statistical relationship between two variables is called **bivariate analysis. Describing the statistical relationship between multiple variables is called **multivariate analysis.
**There are two types of Descriptive Statistics:
- The measure of central tendency
- Measure of variability
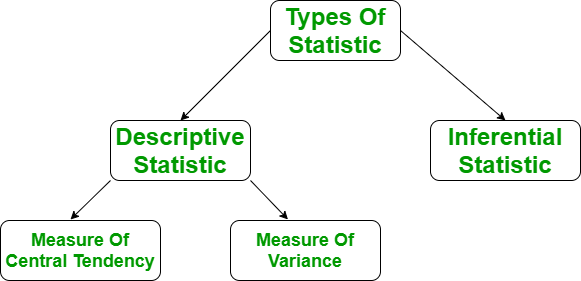
Types of Descriptive Statistics
Measure of Central Tendency
The measure of central tendency is a single value that attempts to describe the whole set of data. There are three main features of central tendency:
- Mean
- Median
- Median Low
- Median High
- Mode
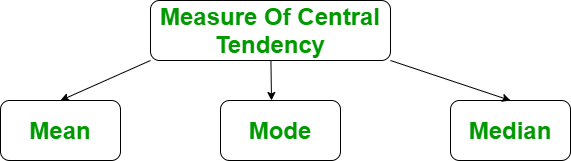
The measure of Central Tendency
Mean
It is the sum of observations divided by the total number of observations. It is also defined as average which is the sum divided by count.
Mean (\overline{x}) = \frac{\sum{x}}{n}
The **mean()function returns the mean or average of the data passed in its arguments. If the passed argument is empty, **StatisticsError is raised.
**Example: Python code to calculate mean
Python `
Python code to demonstrate the working of
mean()
importing statistics to handle statistical
operations
import statistics
initializing list
li = [1, 2, 3, 3, 2, 2, 2, 1]
using mean() to calculate average of list
elements
print ("The average of list values is : ",end="") print (statistics.mean(li))
`
**Output:
The average of list values is : 2
Median
It is the middle value of the data set. It splits the data into two halves. If the number of elements in the data set is odd then the center element is the median and if it is even then the median would be the average of two central elements. it first sorts the data i=and then performs the median operation
**For Odd Numbers:
\frac{n+1}{2}
**For Even Numbers:
{\frac{n}{2} + (\frac{n}{2}+1)}\over{2}
The **median() function is used to calculate the median, i.e middle element of data. If the passed argument is empty, **StatisticsError is raised.
**Example: Python code to calculate Median
Python `
Python code to demonstrate the
working of median() on various
range of data-sets
importing the statistics module
from statistics import median
Importing fractions module as fr
from fractions import Fraction as fr
tuple of positive integer numbers
data1 = (2, 3, 4, 5, 7, 9, 11)
tuple of floating point values
data2 = (2.4, 5.1, 6.7, 8.9)
tuple of fractional numbers
data3 = (fr(1, 2), fr(44, 12), fr(10, 3), fr(2, 3))
tuple of a set of negative integers
data4 = (-5, -1, -12, -19, -3)
tuple of set of positive
and negative integers
data5 = (-1, -2, -3, -4, 4, 3, 2, 1)
Printing the median of above datasets
print("Median of data-set 1 is % s" % (median(data1))) print("Median of data-set 2 is % s" % (median(data2))) print("Median of data-set 3 is % s" % (median(data3))) print("Median of data-set 4 is % s" % (median(data4))) print("Median of data-set 5 is % s" % (median(data5)))
`
**Output:
Median of data-set 1 is 5
Median of data-set 2 is 5.9
Median of data-set 3 is 2
Median of data-set 4 is -5
Median of data-set 5 is 0.0
Median Low
The **median_low() function returns the median of data in case of odd number of elements, but in case of even number of elements, returns the lower of two middle elements. If the passed argument is empty, **StatisticsError is raised
**Example: Python code to calculate Median Low
Python `
Python code to demonstrate the
working of median_low()
importing the statistics module
import statistics
simple list of a set of integers
set1 = [1, 3, 3, 4, 5, 7]
Print median of the data-set
Median value may or may not
lie within the data-set
print("Median of the set is % s" % (statistics.median(set1)))
Print low median of the data-set
print("Low Median of the set is % s " % (statistics.median_low(set1)))
`
**Output:
Median of the set is 3.5
Low Median of the set is 3
Median High
The **median_high() function returns the median of data in case of odd number of elements, but in case of even number of elements, returns the higher of two middle elements. If passed argument is empty, **StatisticsError is raised.
**Example: Python code to calculate Median High
Python `
Working of median_high() and median() to
demonstrate the difference between them.
importing the statistics module
import statistics
simple list of a set of integers
set1 = [1, 3, 3, 4, 5, 7]
Print median of the data-set
Median value may or may not
lie within the data-set
print("Median of the set is %s" % (statistics.median(set1)))
Print high median of the data-set
print("High Median of the set is %s " % (statistics.median_high(set1)))
`
**Output:
Median of the set is 3.5
High Median of the set is 4
Mode
It is the value that has the highest frequency in the given data set. The data set may have no mode if the frequency of all data points is the same. Also, we can have more than one mode if we encounter two or more data points having the same frequency.
The **mode() function returns the number with the maximum number of occurrences. If the passed argument is empty, **StatisticsError is raised.
**Example: Python code to calculate Mode
Python `
Python code to demonstrate the
working of mode() function
on a various range of data types
Importing the statistics module
from statistics import mode
Importing fractions module as fr
Enables to calculate harmonic_mean of a
set in Fraction
from fractions import Fraction as fr
tuple of positive integer numbers
data1 = (2, 3, 3, 4, 5, 5, 5, 5, 6, 6, 6, 7)
tuple of a set of floating point values
data2 = (2.4, 1.3, 1.3, 1.3, 2.4, 4.6)
tuple of a set of fractional numbers
data3 = (fr(1, 2), fr(1, 2), fr(10, 3), fr(2, 3))
tuple of a set of negative integers
data4 = (-1, -2, -2, -2, -7, -7, -9)
tuple of strings
data5 = ("red", "blue", "black", "blue", "black", "black", "brown")
Printing out the mode of the above data-sets
print("Mode of data set 1 is % s" % (mode(data1))) print("Mode of data set 2 is % s" % (mode(data2))) print("Mode of data set 3 is % s" % (mode(data3))) print("Mode of data set 4 is % s" % (mode(data4))) print("Mode of data set 5 is % s" % (mode(data5)))
`
**Output:
Mode of data set 1 is 5
Mode of data set 2 is 1.3
Mode of data set 3 is 1/2
Mode of data set 4 is -2
Mode of data set 5 is black
Refer to the below article to get detailed information about averages and Measures of central tendency.
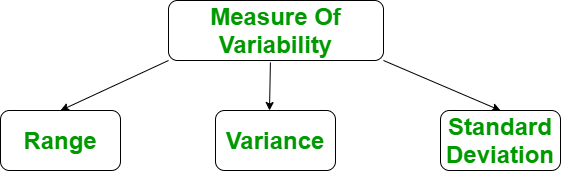
Measure of Variability
Till now, we have studied the measure of central tendency but this alone is not sufficient to describe the data. To overcome this we need the **measure of variability. The measure of variability is known as the spread of data or how well our data is distributed. The most common variability measures are:
- Range
- Variance
- Standard deviation
Range
The difference between the largest and smallest data point in our data set is known as the range. The range is directly proportional to the spread of data which means the bigger the range, the more the spread of data and vice versa.
Range = Largest data value – smallest data value
We can calculate the maximum and minimum values using the **max() and **min() methods respectively.
**Example: Python code to calculate Range
Python `
Sample Data
arr = [1, 2, 3, 4, 5]
#Finding Max Maximum = max(arr)
Finding Min
Minimum = min(arr)
Difference Of Max and Min
Range = Maximum-Minimum
print("Maximum = {}, Minimum = {} and Range = {}".format(
Maximum, Minimum, Range))
`
**Output:
Maximum = 5, Minimum = 1 and Range = 4
Variance
It is defined as an average squared deviation from the mean. It is calculated by finding the difference between every data point and the average which is also known as the mean, squaring them, adding all of them, and then dividing by the number of data points present in our data set.
\sigma^2=\frac{\sum(x-\mu^2)}{N}
where N = number of terms
u = Mean
The statistics module provides the **variance() method that does all the maths behind the scene. If the passed argument is empty, **StatisticsError is raised.
**Example: Python code to calculate Variance
Python `
Python code to demonstrate variance()
function on varying range of data-types
importing statistics module
from statistics import variance
importing fractions as parameter values
from fractions import Fraction as fr
tuple of a set of positive integers
numbers are spread apart but not very much
sample1 = (1, 2, 5, 4, 8, 9, 12)
tuple of a set of negative integers
sample2 = (-2, -4, -3, -1, -5, -6)
tuple of a set of positive and negative numbers
data-points are spread apart considerably
sample3 = (-9, -1, -0, 2, 1, 3, 4, 19)
tuple of a set of fractional numbers
sample4 = (fr(1, 2), fr(2, 3), fr(3, 4), fr(5, 6), fr(7, 8))
tuple of a set of floating point values
sample5 = (1.23, 1.45, 2.1, 2.2, 1.9)
Print the variance of each samples
print("Variance of Sample1 is % s " % (variance(sample1))) print("Variance of Sample2 is % s " % (variance(sample2))) print("Variance of Sample3 is % s " % (variance(sample3))) print("Variance of Sample4 is % s " % (variance(sample4))) print("Variance of Sample5 is % s " % (variance(sample5)))
`
**Output:
Variance of Sample1 is 15.80952380952381
Variance of Sample2 is 3.5
Variance of Sample3 is 61.125
Variance of Sample4 is 1/45
Variance of Sample5 is 0.17613000000000006
Standard Deviation
It is defined as the square root of the variance. It is calculated by finding the Mean, then subtracting each number from the Mean which is also known as the average, and squaring the result. Adding all the values and then dividing by the no of terms followed by the square root.
\sigma=\sqrt\frac{\sum(x-\mu)^2}{N}
where N = number of terms
u = Mean
The **stdev()method of the statistics module returns the standard deviation of the data. If the passed argument is empty, **StatisticsError is raised.
**Example: Python code to calculate Standard Deviation
Python `
Python code to demonstrate stdev()
function on various range of datasets
importing the statistics module
from statistics import stdev
importing fractions as parameter values
from fractions import Fraction as fr
creating a varying range of sample sets
numbers are spread apart but not very much
sample1 = (1, 2, 5, 4, 8, 9, 12)
tuple of a set of negative integers
sample2 = (-2, -4, -3, -1, -5, -6)
tuple of a set of positive and negative numbers
data-points are spread apart considerably
sample3 = (-9, -1, -0, 2, 1, 3, 4, 19)
tuple of a set of floating point values
sample4 = (1.23, 1.45, 2.1, 2.2, 1.9)
Print the standard deviation of
following sample sets of observations
print("The Standard Deviation of Sample1 is % s" % (stdev(sample1)))
print("The Standard Deviation of Sample2 is % s" % (stdev(sample2)))
print("The Standard Deviation of Sample3 is % s" % (stdev(sample3)))
print("The Standard Deviation of Sample4 is % s" % (stdev(sample4)))
`
**Output:
The Standard Deviation of Sample1 is 3.9761191895520196
The Standard Deviation of Sample2 is 1.8708286933869707
The Standard Deviation of Sample3 is 7.8182478855559445
The Standard Deviation of Sample4 is 0.41967844833872525
Refer to the below article to get detailed information about the Measure of variability.[Statistical Functions in Python | Set 2 ( Measure of Spread)]