What is a trend in time series? (original) (raw)
Last Updated : 8 Apr, 2026
Time series data is a sequence of values recorded over time. It is widely used across industries to analyze patterns, monitor changes and make forecasts. Before modeling, it's important to check for key components in the data, such as trend, seasonality and cycles.
A trend is a long-term upward or downward movement in time series data. It is observed as an increasing or decreasing slope over a period of time. Trends usually last for a while but do not repeat regularly.
**Example: A new song may trend for a few weeks (uptrend) and then fade away.
Types of Trend
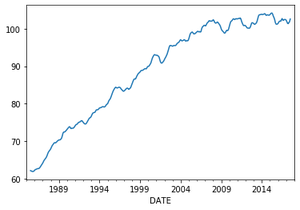
- **Uptrend: When a time series shows a consistent increase in values over time, it is called an uptrend.
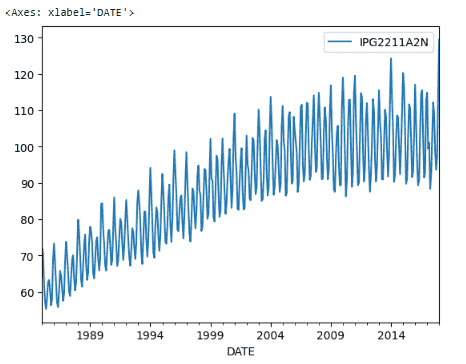
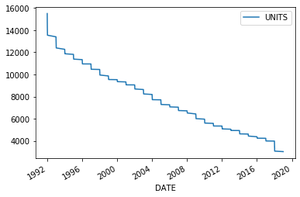
- **Downtrend: When a time series shows a consistent decrease in values over time, it is referred to as a downtrend.
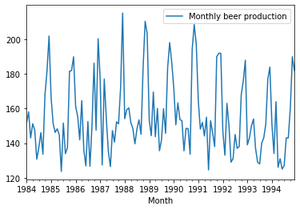
- **Horizontal or Stationary Trend: When the values fluctuate around a constant level with no clear upward or downward movement, it is called a horizontal or stationary trend.
Trends can be detected visually or through decomposition of the dataset.
Detecting Trend using Visualization
By simply plotting the dataset you can see the general trend in data.
**Approach:
- Import the required modules.
- Load the dataset.
- Convert the date/month column to a datetime object.
- Set the date/month as the index.
- Create a plot to visualize the trend.
**Note: In the examples given below the same code is used to show all three trends just the dataset used is different to reflect that particular trend.
To Download the csv file used in this article, click here
**Example: Uptrend
Python `
import pandas as pd import matplotlib
data = pd.read_csv("Electric_Production.csv")
data['DATE'] = pd.to_datetime(data['DATE']) data = data.set_index('DATE')
data.plot()
`
**Output
**Explanation:
- **data['DATE'] = pd.to_datetime(data['DATE']): Converts the DATE column into datetime format for time series analysis.
- **data = data.set_index('DATE'): Sets DATE as the index so the data is treated as time-based.
**Example: Downtrend
Python `
import pandas as pd import matplotlib
data = pd.read_csv("Electric_Production.csv")
data['DATE'] = pd.to_datetime(data['DATE']) data = data.set_index('DATE')
data.plot()
`
**Output
**Example: Horizontal Trend
Python `
import pandas as pd import matplotlib
data = pd.read_csv( r'C:\Users\admin\Downloads\monthly-beer-production-in-austr.csv')
data['Month'] = pd.to_datetime(data['Month'])
data = data.set_index('Month') data['1984':'1994'].plot()
`
**Output
Detecting Trend using Decomposition
Linear plots may not always show the full trend clearly. The seasonal_decompose() function from statsmodels can break a time series into trend, seasonality, and residual components. We can access the trend component using seasonal_decompose().trend. This function estimates the trend using moving averages, helping to reveal the long-term pattern hidden in the data.
Syntax
statsmodels.tsa.seasonal.seasonal_decompose(x, model='additive', period=None, extrapolate_trend=0)
**Parameters:
- **x: array-like. Time-Series. If 2d, individual series are in columns. x must contain 2 complete cycles.
- **model: {“additive”, “multiplicative”}, optional (Depends on nature on seasonal component)
- **period(freq.): nt, optional. Must be use if x is not pandas object or index of x does not have a frequency.
**Returns: An object with seasonal, trend, and resid attributes.
**Example:
Python `
from statsmodels.tsa.seasonal import seasonal_decompose output = seasonal_decompose(data, model='multiplicative').trend
output.plot()
`
**Output