Statistics for GATE (original) (raw)
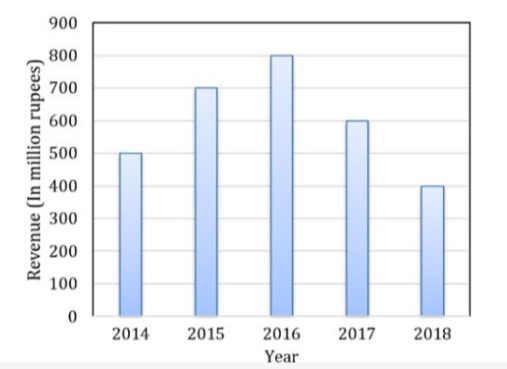
The total revenue of a company during 2014−2018 is shown in the bar graph. If the total expenditure of the company in each year is 500 million rupees, then the aggregate profit or loss (in percentage) on the total expenditure of the company during 2014−2018 is _________ .
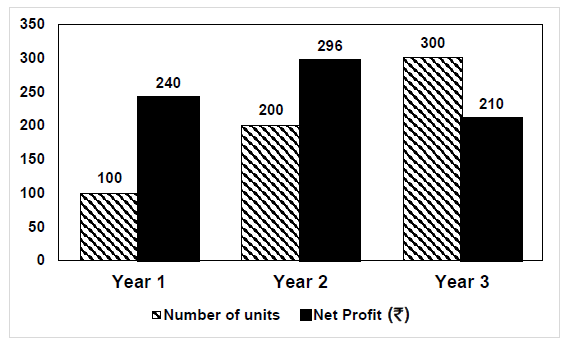
The number of units of a product sold in three different years and the respective net profits are presented in the figure above. The cost/unit in Year 3 was Re. 1, which was half the cost/unit in Year 2. The cost/unit in Year 3 was one-third of the cost/unit in Year 1. Taxes were paid on the selling price at 10%, 13%, and 15% respectively for the three years. Net profit is calculated as the difference between the selling price and the sum of cost and taxes paid in that year. The ratio of the selling price in Year 2 to the selling price in Year 3 is _________. **[GATE 2021 || Set-2 || 2 Marks || MCQ]
Find the variance in uniform distribution if X is uniformly distributed over (5, 30)?
Compute the median for the exponential distribution with parameter 𝜆.
Let X be an R.V. with mean 𝜇 and variance 𝝈^𝟐>0. If 𝝃𝒒 denotes the 𝒒𝒕𝒉 quantile of X, which is true?
- (𝜇-𝜎) √ (𝟏−𝒒)/ 𝒒 ≤ 𝝃𝒒 ≤ (𝜇+𝜎) √ 𝒒/(𝟏−𝒒)
- (𝜇-𝜎) √ (𝟏+𝒒)/ 𝒒 ≤ 𝝃𝒒 ≤ (𝜇+𝜎) √ 𝒒/(𝟏+𝒒)
- (𝜇-𝜎) √ 𝒒/(1- 𝒒) ≤ 𝝃𝒒 ≤ (𝜇+𝜎) √ 𝒒/(𝟏+𝒒)
- (𝜇-𝜎) √ (1+𝒒)/(1- 𝒒) ≤ 𝝃𝒒 ≤ (𝜇+𝜎) √ (1-𝒒)/(𝟏+𝒒)
Which of the following statements can be inferred about the mean, median, and mode of the normal distribution _P(_x) for a variable _x?
If a variable takes the discrete values α − 4, α − 7 / 2, α − 5 / 2, α − 3, α − 2, α + 1 / 2, α − 1 / 2, α + 5 (α > 0), then the median is
The following data gives the distribution of the height of students.
| Height (in Cm) | 161 | 160 | 155 | 154 | 152 | 150 |
|---|---|---|---|---|---|---|
| No. of Students | 3 | 12 | 7 | 3 | 8 | 8 |
What is the median of the distribution?
There are 8 questions to complete.
Take a part in the ongoing discussion