RData Frames (original) (raw)
R Programming Language is an open-source programming language that is widely used as a statistical software and data analysis tool. **Data Frames in R Language are generic data objects of R that are used to store tabular data.
Data frames can also be interpreted as matrices where each column of a matrix can be of different data types. R data frame is made up of three principal components, the data, rows, and columns.
R Data Frames Structure
As we can see in the image below, this is how a data frame is structured. The data is presented in tabular form, which makes it easier to operate and understand.

R - Data Frames
1. Create Data Frame in R Programming Language
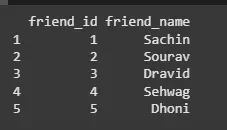
To create an R data frame use **data.frame() function and then pass each of the vectors we have created as arguments to the function.
R `
friend.data <- data.frame( friend_id = c(1:5), friend_name = c("Sachin", "Sourav", "Dravid", "Sehwag", "Dhoni"), stringsAsFactors = FALSE ) print(friend.data)
`
**Output:
R - Data Frames
2. Printing Structure of the R Data Frame
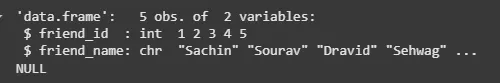
One can get the structure of the R data frame using **str() function in R. It can display even the internal structure of large lists which are nested. It provides one-liner output for the basic R objects letting the user know about the object and its constituents.
R `
friend.data <- data.frame( friend_id = c(1:5), friend_name = c("Sachin", "Sourav", "Dravid", "Sehwag", "Dhoni"), stringsAsFactors = FALSE ) print(str(friend.data))
`
**Output:
R - Data Frames
3. Summary of Data in the R data frame
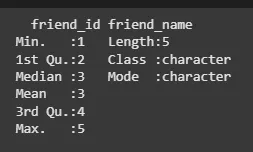
In the R data frame, the statistical summary and nature of the data can be obtained by applying **summary() function. It is a generic function used to produce result summaries of the results of various model fitting functions. The function invokes particular methods which depend on the class of the first argument.
R `
friend.data <- data.frame( friend_id = c(1:5), friend_name = c("Sachin", "Sourav", "Dravid", "Sehwag", "Dhoni"), stringsAsFactors = FALSE ) print(summary(friend.data))
`
**Output:
R - Data Frames
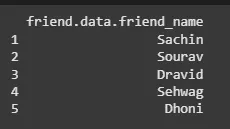
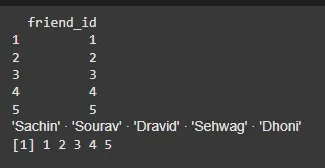
Extracting data from an R data frame means that to access its rows or columns. One can extract a specific column from an R data frame using its column name.
R `
friend.data <- data.frame( friend_id = c(1:5), friend_name = c("Sachin", "Sourav", "Dravid", "Sehwag", "Dhoni"), stringsAsFactors = FALSE )
result <- data.frame(friend.data$friend_name) print(result)
`
**Output:
R - Data Frames
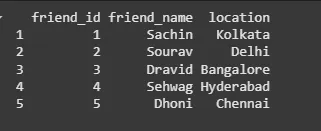
5. Expand Data Frame in R
A data frame in R can be expanded by adding new columns and rows to the already existing R data frame.
R `
friend.data <- data.frame( friend_id = c(1:5), friend_name = c("Sachin", "Sourav", "Dravid", "Sehwag", "Dhoni"), stringsAsFactors = FALSE )
friend.data$location <- c("Kolkata", "Delhi", "Bangalore", "Hyderabad", "Chennai") resultant <- friend.data print(resultant)
`
**Output:
R - Data Frames
In R, one can perform various types of operations on a data frame like **accessing rows and columns, selecting the subset of the data frame, editing data frames, delete rows and columns in a data frame, etc.
Please refer to DataFrame Operations in R to know about all types of operations that can be performed on a data frame.
6. Access Items in R Data Frame
We can select and access any element from data frame by using single $ ,brackets [ ] or double brackets [[]] to access columns from a data frame.
R `
friend.data <- data.frame( friend_id = c(1:5), friend_name = c("Sachin", "Sourav", "Dravid", "Sehwag", "Dhoni"), stringsAsFactors = FALSE )
print(friend.data[1])
friend.data[['friend_name']]
print(friend.data$friend_id)
`
**Output:
R - Data Frames
7. Amount of Rows and Columns in R Data Frame
We can find out how many rows and columns present in our data frame by using dim function.
R `
friend.data <- data.frame( friend_id = c(1:5), friend_name = c("Sachin", "Sourav", "Dravid", "Sehwag", "Dhoni"), stringsAsFactors = FALSE )
dim(friend.data)
`
**Output:
[1] 5 2
8. Add Rows and Columns
We can easily add rows and columns in a data frame. Insertion helps in expanding the already existing data frame, without needing a new one.
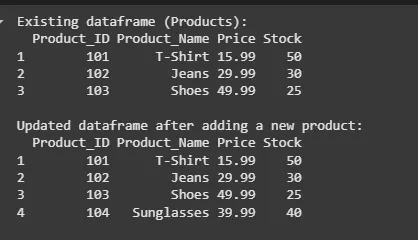
8.1 Add Rows in R Data Frame
To add rows in a Data Frame, we can use a built-in function **rbind(). Following example demonstrate the working of rbind() in R Data Frame.
R `
Products <- data.frame( Product_ID = c(101, 102, 103), Product_Name = c("T-Shirt", "Jeans", "Shoes"), Price = c(15.99, 29.99, 49.99), Stock = c(50, 30, 25) )
cat("Existing dataframe (Products):\n") print(Products)
New_Product <- c(104, "Sunglasses", 39.99, 40) Products <- rbind(Products, New_Product)
cat("\nUpdated dataframe after adding a new product:\n") print(Products)
`
**Output:
R - Data Frames
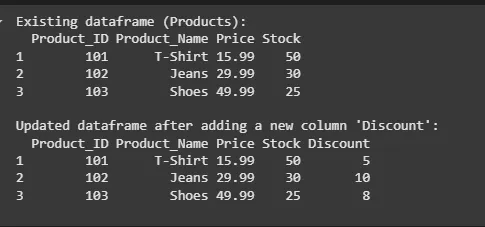
8.2 Add Columns in R Data Frame
To add columns in a Data Frame, we can use a built-in function cbind(). Following example demonstrate the working of cbind() in R Data Frame.
R `
Products <- data.frame( Product_ID = c(101, 102, 103), Product_Name = c("T-Shirt", "Jeans", "Shoes"), Price = c(15.99, 29.99, 49.99), Stock = c(50, 30, 25) )
cat("Existing dataframe (Products):\n") print(Products)
Discount <- c(5, 10, 8) Products <- cbind(Products, Discount)
colnames(Products)[ncol(Products)] <- "Discount"
cat("\nUpdated dataframe after adding a new column 'Discount':\n") print(Products)
`
**Output:
R - Data Frames
9. Remove Rows and Columns
A data frame in R removes columns and rows from the already existing R data frame.
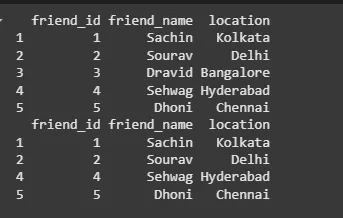
**9.1 Remove Row in R Data Frame
We first created a data frame called data with three columns: friend_id, friend_name, and location. To remove a row with friend_id equal to 3, we used the subset() function and specified the condition friend_id != 3. This removed the row with friend_id equal to 3.
R `
library(dplyr)
data <- data.frame( friend_id = c(1, 2, 3, 4, 5), friend_name = c("Sachin", "Sourav", "Dravid", "Sehwag", "Dhoni"), location = c("Kolkata", "Delhi", "Bangalore", "Hyderabad", "Chennai") )
print(data)
data <- subset(data, friend_id != 3)
print(data)
`
**Output:
R - Data Frames
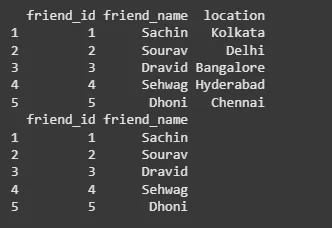
**9.2 Remove Column in R Data Frame
To remove the location column, we used the **select() function and specified -location. The - sign indicates that we want to remove the location column. The resulting data frame data will have only two columns: friend_id and friend_name.
R `
library(dplyr)
data <- data.frame( friend_id = c(1, 2, 3, 4, 5), friend_name = c("Sachin", "Sourav", "Dravid", "Sehwag", "Dhoni"), location = c("Kolkata", "Delhi", "Bangalore", "Hyderabad", "Chennai") )
print(data)
data <- select(data, -location)
print(data)
`
**Output:
R - Data Frames
10. Combining Data Frames in R
There are 2 way to combine data frames in R. we can either combine them vertically or horizontally. Let's look at both cases with example:
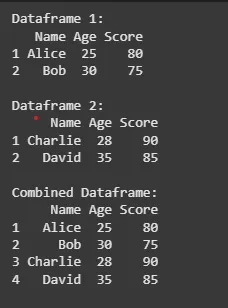
10.1 Combine Data Frame Vertically
If we want to combine 2 data frames vertically, we can use **rbind() function. This function works for combination of two or more data frames.
R `
df1 <- data.frame( Name = c("Alice", "Bob"), Age = c(25, 30), Score = c(80, 75) )
df2 <- data.frame( Name = c("Charlie", "David"), Age = c(28, 35), Score = c(90, 85) )
cat("Dataframe 1:\n") print(df1)
cat("\nDataframe 2:\n") print(df2)
combined_df <- rbind(df1, df2)
cat("\nCombined Dataframe:\n") print(combined_df)
`
**Output:
R - Data Frames
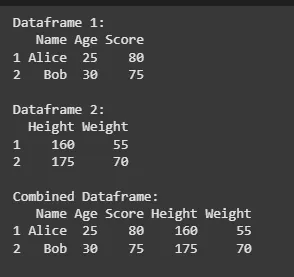
10.2 Combine Data Frame Horizontally
If we want to combine 2 data frames horizontally, we can use **cbind() function. This function works for combination of two or more data frames.
R `
df1 <- data.frame( Name = c("Alice", "Bob"), Age = c(25, 30), Score = c(80, 75) )
df2 <- data.frame( Height = c(160, 175), Weight = c(55, 70) )
cat("Dataframe 1:\n") print(df1)
cat("\nDataframe 2:\n") print(df2)
combined_df <- cbind(df1, df2)
cat("\nCombined Dataframe:\n") print(combined_df)
`
**Output:
R - Data Frames
In this article we have covered **R Data Frames, and all basic operations like create, access, summary, add and remove.
**Also Read: