Adding Straight Lines to a Plot in R Programming abline() Function (original) (raw)
Last Updated : 15 Jul, 2025
**abline()** function in R Language is used to add one or more straight lines to a graph. The abline() function can be used to add vertical, horizontal or regression lines to plot.
Syntax:abline(a=NULL, b=NULL, h=NULL, v=NULL, ...)Parameters: a, b: It specifies the intercept and the slope of the lineh: specifies y-value for horizontal line(s)v: specifies x-value(s) for vertical line(s)Returns: a straight line in the plot
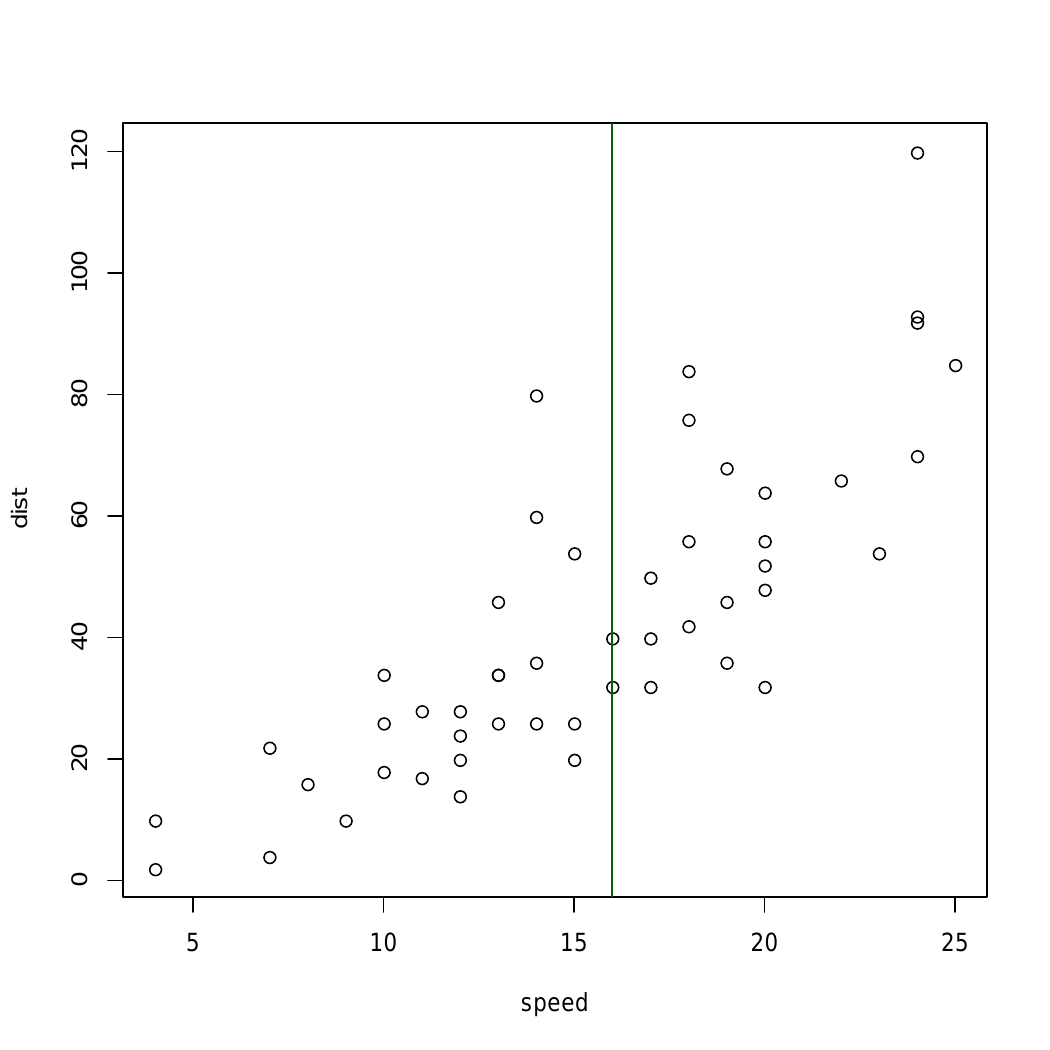
Example 1: To add a vertical line to the plot
r `
add line to square plot
first example : Add one line
plot(cars) abline(v = 16, col = "darkgreen")
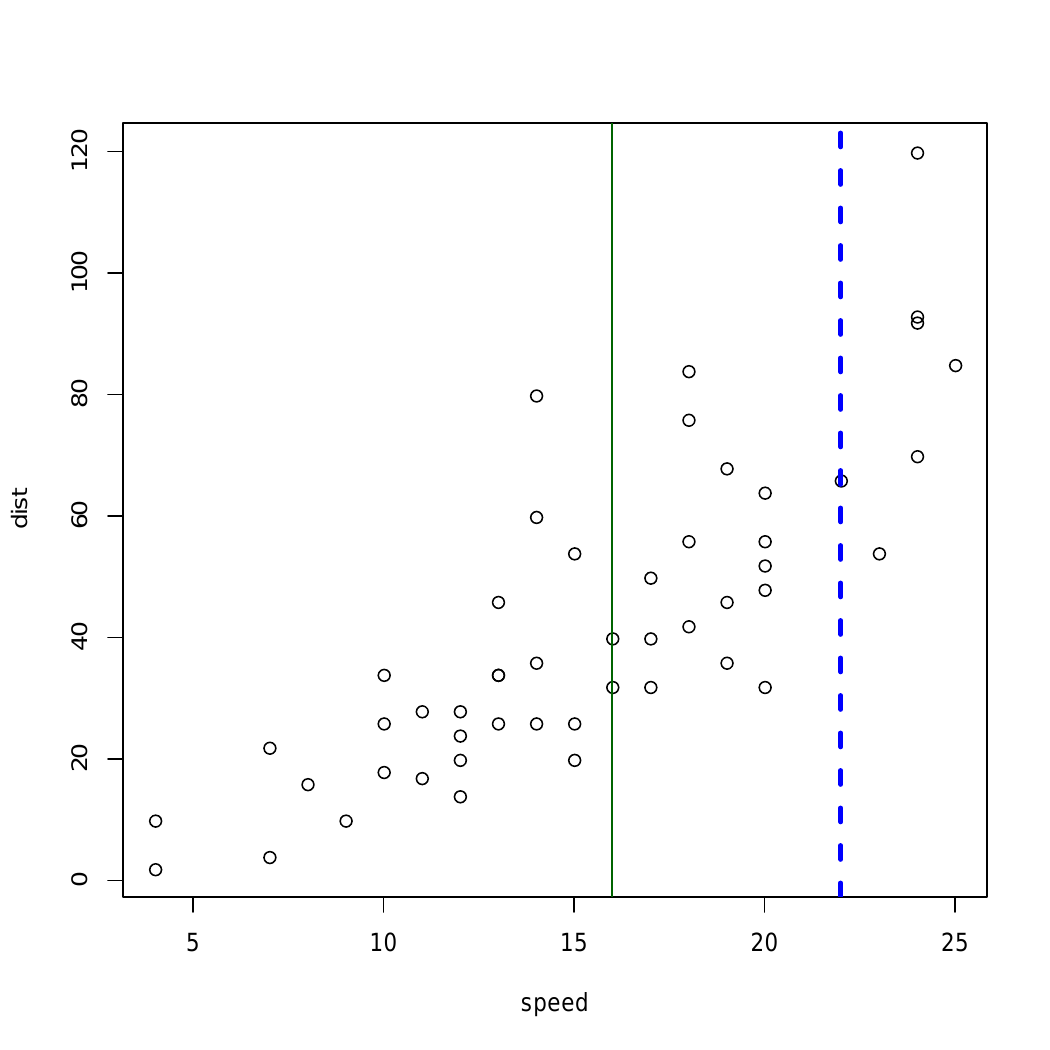
second example : add 2 lines
addline to square plot
change line colors, sizes and types
plot(cars) abline(v = c(16, 22), col = c("darkgreen", "blue"), lty = c(1, 2), lwd = c(1, 3))
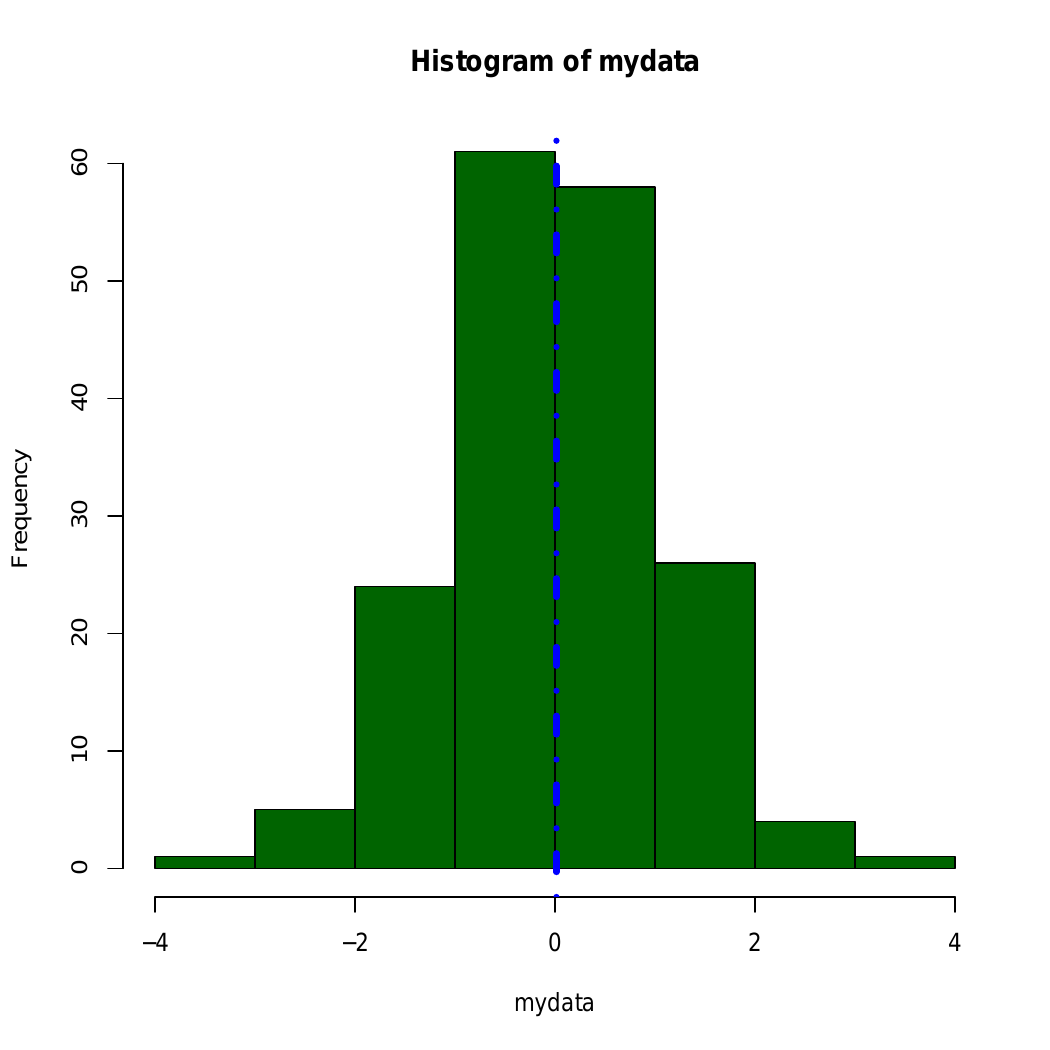
third example
set.seed(1200); mydata<-rnorm(180) hist(mydata, col="darkgreen")
lwd=line width, lty =linetype
abline(v = mean(mydata), col = "blue", lwd = 4, lty = 4)
`
Output:
Here, in above example straight line is added using abline() to different graphical plots
Example 2: To add a horizontal line
r `
R program to add a horizontal line
to a plot
Creating a plot
plot(cars)
Calling abline() function
abline(h = 60, col = "darkgreen")
`
Output:
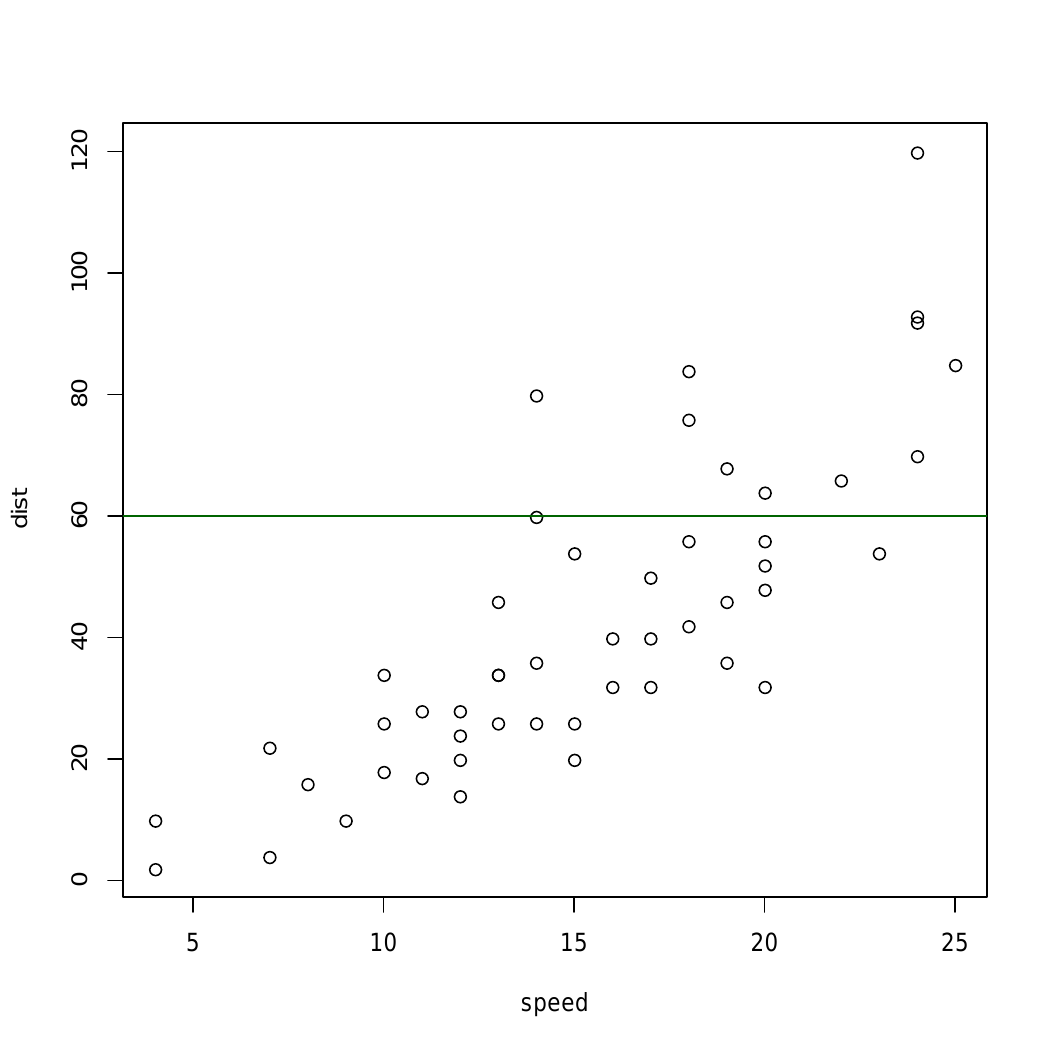
In above example abline() Function draws an horizontal line on the current plot at the specified ‘x’ coordinates.
Example 3: To add a regression line
r `
par(mgp = c(2, 1, 0), mar = c(3, 3, 1, 1))
Fit regression line
require(stats) reg<-lm(dist ~ speed, data = cars) coeff = coefficients(reg)
equation of the line :
eq = paste0("y = ", round(coeff[1], 1), "*x ", round(coeff[2], 1))
plot
plot(cars, main = eq) abline(reg, col = "darkgreen")
`
Output:
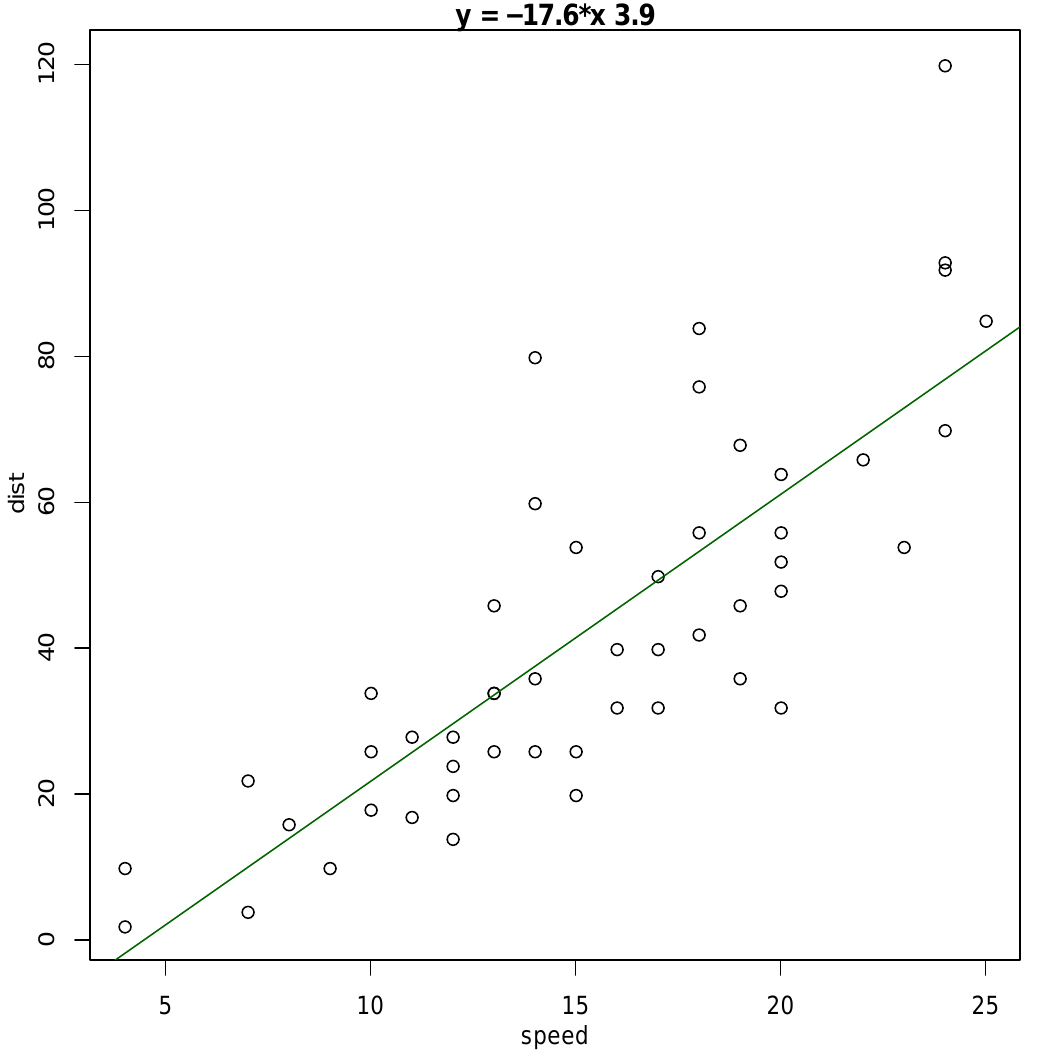 In the above example, straight-line is added using the line equation and
 abline() function and plot relation between speed and distance.