ANOVA (Analysis of Variance) Test in R Programming (original) (raw)
Last Updated : 14 Apr, 2026
ANOVA (Analysis of Variance) is a statistical technique used to analyze the relationship between categorical variables and continuous variables in R. It helps determine whether the means of different groups are significantly different by comparing the variation within groups to the variation between groups. ANOVA is widely used in business, biology, social sciences and experimental research.

Anova
Understanding Hypotheses in ANOVA
ANOVA is used to test if group means of a continuous variable differ based on categorical grouping.
- **Null Hypothesis (H₀): All group means are equal; no effect of the categorical variable.
- **Alternative Hypothesis (H₁): At least one group mean is different; the categorical variable has an effect.
Assumptions of ANOVA
ANOVA relies on several key assumptions to ensure valid results:
- **Normality: The data within each group should be normally distributed.
- **Homogeneity of Variance: The variance among the groups should be approximately equal.
- **Independence: Observations must be independent of each other.
- **Randomness: The sample should be randomly selected
Types of ANOVA
- **One-Way ANOVA: Involves one categorical independent variable and one continuous dependent variable.
- **Two-Way ANOVA: Involves two categorical independent variables and one continuous dependent variable and can also detect interactions between the two factors.
Implementation of ANOVA Test
We perform the ANOVA tests using the mtcars dataset in R and compare the results of one-way and two-way ANOVA.
1. Installing and Loading Required Packages
We install and load the necessary packages for data manipulation and ANOVA.
- **install.packages: Used to install packages from CRAN.
- **library: Loads the specified package into the R session. R `
install.packages("dplyr") library(dplyr)
`
2. Viewing the Dataset
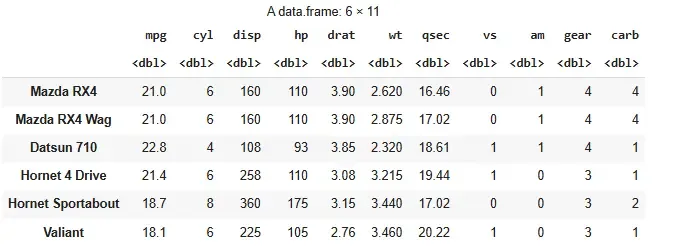
We inspect the first few rows of the dataset to understand the structure.
- **head: Displays the first few rows of a dataset. R `
head(mtcars)
`
**Output:
Output
3. Performing One-Way ANOVA
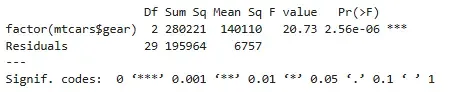
We conduct a one-way ANOVA to examine if the mean displacement (disp) differs across gear levels (gear).
- **aov: Performs ANOVA.
- **factor: Converts a variable into a categorical factor.
- **summary: Displays the ANOVA result. R `
mtcars_aov <- aov(mtcars$disp ~ factor(mtcars$gear)) summary(mtcars_aov)
`
**Output:
Output
- **Df: Degrees of freedom.
- **Sum Sq: Sum of squares within and between groups.
- **Mean Sq: Mean of the sum of squares.
- **F value: Ratio of variance between groups to variance within groups.
- **Pr(>F): P-value indicating statistical significance.
4. Performing Two-Way ANOVA
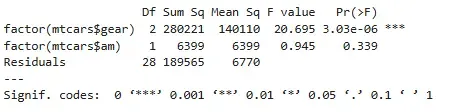
We conduct a two-way ANOVA to analyze the influence of both gear and am (transmission) on disp.
- **aov: Used again for two-way ANOVA.
- **factor: Converts gear and am to categorical variables. R `
mtcars_aov2 <- aov(mtcars$disp ~ factor(mtcars$gear) * factor(mtcars$am)) summary(mtcars_aov2)
`
**Output:
Output
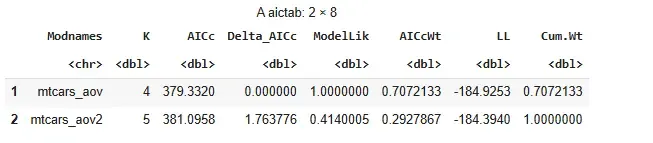
5. Finding the Best-Fit Model with AIC
We compare both models using AIC to determine the better fit.
- **AICcmodavg: Package used for AIC comparison.
- **aictab: Compares models using AIC scores. R `
install.packages("AICcmodavg") library(AICcmodavg) model.set <- list(mtcars_aov, mtcars_aov2) model.names <- c("mtcars_aov", "mtcars_aov2") aictab(model.set, modnames = model.names)
`
**Output:
Output
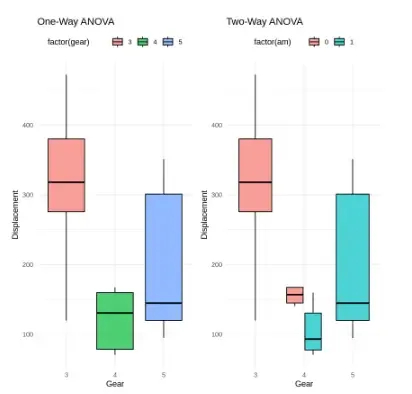
6. Visualizing the ANOVA Results
We use ggplot2 to visualize the distribution of disp across gear levels.
- **ggplot2: Used for creating elegant data visualizations.
- **ggplot: Initializes the plot object.
- **geom_boxplot: Creates boxplots.
- **labs: Adds titles and axis labels.
- **theme_minimal: Applies a minimal theme to the plot.
- **gridExtra: Arranges multiple plots side-by-side. R `
install.packages("gridExtra") library(gridExtra)
install.packages("ggplot2") library(ggplot2)
plot1 <- ggplot(mtcars, aes(x = factor(gear), y = disp, fill = factor(gear))) + geom_boxplot(color = "black", alpha = 0.7) + labs(title = "One-Way ANOVA", x = "Gear", y = "Displacement") + theme_minimal() + theme(legend.position = "top")
plot2 <- ggplot(mtcars, aes(x = factor(gear), y = disp, fill = factor(am))) + geom_boxplot(color = "black", alpha = 0.7) + labs(title = "Two-Way ANOVA", x = "Gear", y = "Displacement") + theme_minimal() + theme(legend.position = "top")
grid.arrange(plot1, plot2, ncol = 2)
`
**Output:
Output
- One-way ANOVA shows that gear has a significant effect on disp (p < 0.05).
- Two-way ANOVA reveals that while gear significantly affects disp, the am variable does not.
- AIC comparison suggests that the simpler model (mtcars_aov) is a better fit.
- Visualizations clearly show differences in displacement across gear levels, with or without considering transmission.