Apriori Algorithm in R Programming (original) (raw)
Last Updated : 5 Jul, 2025
The Apriori algorithm is used in data mining to find items that often appear together in transaction data, like shopping baskets. It looks for frequent item groups and builds larger groups from smaller ones that are already common. By doing this, it helps discover useful patterns, such as products that are often bought together.
**Apriori Property:
All non-empty subsets of a frequent itemset must be frequent. Apriori assumes that all subsets of a frequent itemset must be frequent (Apriori property). If an itemset is infrequent, all its supersets will be infrequent.
ImportantTerminologies
- **Support: Support is an indication of how frequently the itemset appears in the dataset. It is the count of records containing an item ‘x’ divided by the total number of records in the database.
- **Confidence: Confidence is a measure of times such that if an item ‘x’ is bought, then item ‘y’ is also bought together. It is the support count of (x U y) divided by the support count of ‘x’.
- **Lift: Lift is the ratio of the observed support to that which is expected if ‘x’ and ‘y’ were independent. It is the support count of (x U y) divided by the product of individual support counts of ‘x’ and ‘y’.
**Algorithm
- Read each item in the transaction.
- Calculate the support of every item.
- If support is less than minimum support, discard the item. Else, insert it into frequent itemset.
- Calculate confidence for each non- empty subset.
- If confidence is less than minimum confidence, discard the subset. Else, it into strong rules.
Implementation of Apriori Algorithm in R
We implement the Apriori algorithm in R using the arules package to perform Market Basket Analysis on the preloaded Groceries dataset.
1. Installing required packages
We install the arules, arulesViz, and RColorBrewer packages to use their functions for association rule mining and visualizations.
- **arules: Used to mine frequent itemsets and association rules using the Apriori algorithm.
- **arulesViz: Used to visualize association rules and itemsets.
- **RColorBrewer: Used to apply color palettes for better visual output. R `
install.packages("arules") install.packages("arulesViz") install.packages("RColorBrewer")
`
2. Loading required libraries
We load the installed libraries to access their functions and datasets.
- **library(): Used to load installed packages into the R session. R `
library(arules) library(arulesViz) library(RColorBrewer)
`
3. Importing the dataset
We import the Groceries dataset which contains 9835 grocery transactions.
- **data("Groceries"): Loads a predefined transactional dataset containing items bought together. R `
data("Groceries")
`
4. Applying apriori() function
We apply the apriori() function to generate strong association rules from the dataset.
- **apriori(): Used to generate association rules based on support and confidence.
- **parameter = list(supp = 0.01, conf = 0.2): Defines minimum support of 1% and confidence of 20%. R `
rules <- apriori(Groceries, parameter = list(supp = 0.01, conf = 0.2))
`
**Output:
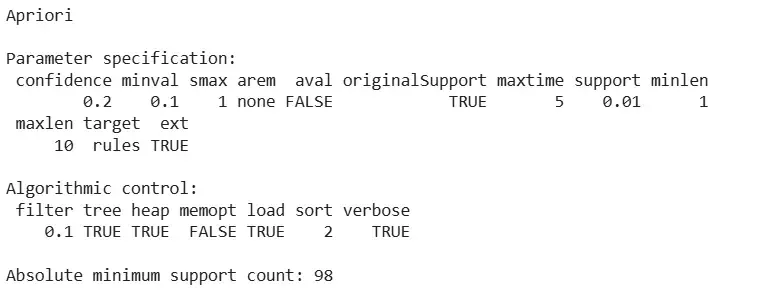
Output
5. Inspecting the rules
We inspect the top 10 association rules generated by the algorithm.
- **inspect(): Used to display the top association rules in a readable format. R `
inspect(rules[1:10])
`
**Output:
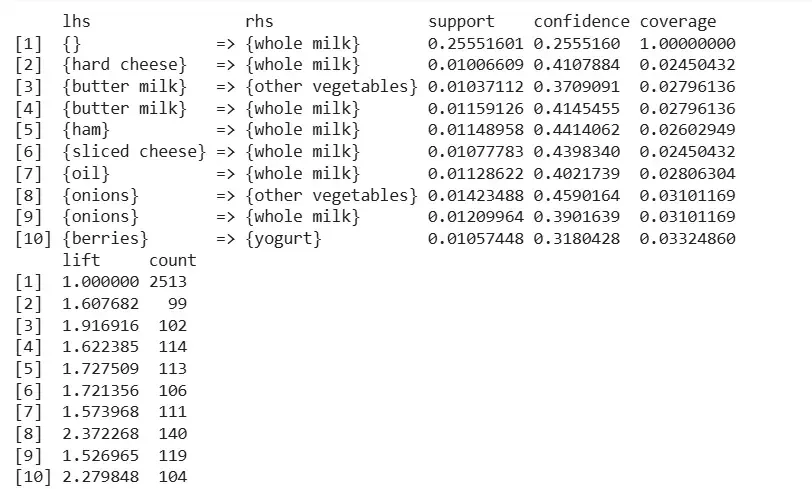
Output
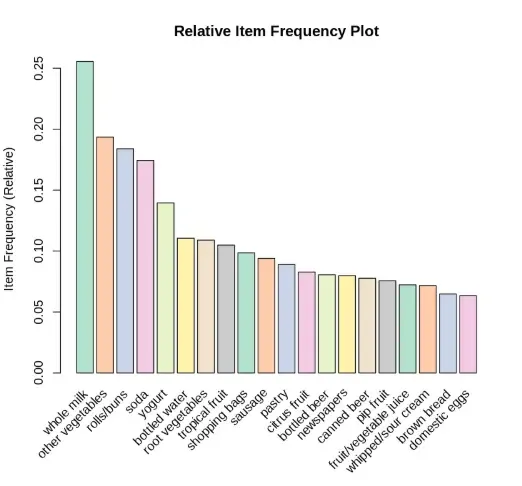
6. Plotting item frequency
We create a bar plot to visualize the top 20 items with highest frequency.
- **itemFrequencyPlot(): Used to create a bar plot of item frequencies.
- **topN = 20: Shows the 20 most frequent items.
- **col = brewer.pal(8, 'Pastel2'): Adds a pastel color palette.
- **type = "relative": Displays relative frequency.
- **ylab = "Item Frequency (Relative)": Labels the y-axis. R `
arules::itemFrequencyPlot(Groceries, topN = 20, col = brewer.pal(8, 'Pastel2'), main = 'Relative Item Frequency Plot', type = "relative", ylab = "Item Frequency (Relative)")
`
**Output:
Output
Application of Apriori Algorithm
- **Market Basket Analysis: used to find combinations of items that are frequently bought together in retail stores or supermarkets.
- **Product Recommendation Systems: helps suggest related products to customers based on what others have frequently bought together.
- **Customer Behavior Analysis: identifies purchasing habits and patterns, helping businesses understand customer preferences.
- **Inventory and Shelf Management: helps store managers place items near each other and maintain stock of frequently paired products.