Association Rule Mining in R Programming (original) (raw)
Last Updated : 5 Jul, 2025
Association Rule Mining is an unsupervised learning technique used to discover interesting relationships, patterns, or associations between items in large transactional datasets. It helps answer questions like, “What products are frequently bought together?” This technique is widely used in market basket analysis, recommendation systems, and customer behavior prediction.
Key Measures in Association Rule Mining
To evaluate and rank the strength of discovered rules, three key metrics are used:
**Support: Support tells how frequently an item or a set of items appears in the dataset.
**Formula:
\text{Support} = \frac{\text{Number of transactions with both A and B}}{\text{Total number of transactions}} = P(A \cap B)
**Confidence: Confidence tells how likely item Y is purchased when item X is purchased.
**Formula:
\text{Confidence} = \frac{\text{Number of transactions with both A and B}}{\text{Number of transactions with A}} = \frac{P(A \cap B)}{P(A)}
**Lift: Lift tells how likely item Y is purchased with X compared to the regular purchase rate of Y. A lift > 1 means X and Y are positively related.
**Formula:
\text{Lift} = \frac{\text{Confidence}}{\text{Expected Confidence}} = \frac{P(A \cap B)}{P(A) \cdot P(B)}
- **Lift > 1: Positive association (items are bought together more than by chance).
- **Lift = 1: No association (independent).
- **Lift < 1: Negative association (less likely to be bought together).
**Example: A customer does 4 transactions with you. In the first transaction, she buys 1 apple, 1 beer, 1 rice, and 1 chicken. In the second transaction, she buys 1 apple, 1 beer, 1 rice. In the third transaction, she buys 1 apple, 1 beer only. In fourth transactions, she buys 1 apple and 1 orange.
**Support(Apple) = 4/4
So, Support of {Apple} is 4 out of 4 or 100%
**Confidence(Apple -> Beer) = Support(Apple, Beer)/Support(Apple)
= (3/4)/(4/4)
= 3/4So, Confidence of {Apple -> Beer} is 3 out of 4 or 75%
**Lift(Beer -> Rice) = Support(Beer, Rice)/(Support(Beer) * Support(Rice))
= (2/4)/(3/4) * (2/4)
= 1.33So, Lift value is greater than 1 implies Rice is likely to be bought if Beer is bought.
Implementation of Association Rule Mining in R
We are performing market basket analysis using the Apriori algorithm on a groceries dataset, where each transaction is grouped by Member_number and items are listed in the itemDescription column.
1. Installing required packages
We install the necessary libraries for rule mining and visualization.
- **install.packages: used to install external R packages from CRAN.
- **arules: Mines association rules (like Apriori/Eclat) from transaction data.
- **arulesViz: Visualizes rules from
arulesusing plots and graphs. - **igraph: Builds and analyzes graph/network data structures.
- **visNetwork: Creates interactive network visualizations in R. R `
install.packages("arules") install.packages("arulesViz") install.packages("igraph") install.packages("visNetwork")
`
2. Loading the libraries
We load the required libraries into the session to make their functions available.
- **library: loads a package into the current R session. R `
library(arules) library(arulesViz) library(igraph) library(visNetwork)
`
3. Reading the dataset
We read the CSV file containing the transactions into R as a data frame.
You can download the dataset from here.
- **read.csv: reads a CSV file into a data frame. R `
data <- read.csv("/content/Groceries data.csv", stringsAsFactors = FALSE)
`
4. Converting data to transaction format
We group items by customer ID to create transactions.
- **split: splits data into groups by a factor (e.g., Member_number).
- **as(..., "transactions"): converts a list to transaction class. R `
transactions_list <- split(data$itemDescription, data$Member_number) transactions <- as(transactions_list, "transactions")
`
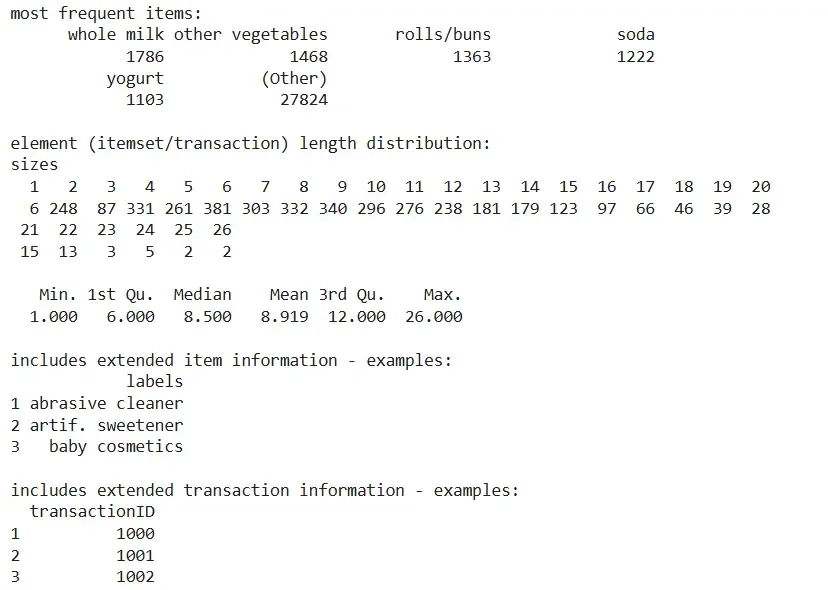
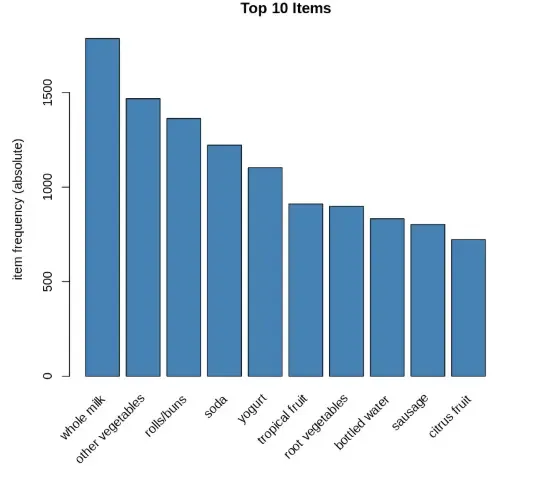
5. Displaying item summary and plotting frequencies
We visualize the top items purchased across all transactions.
- **summary: provides a summary of the transaction object.
- **itemFrequencyPlot: plots the most frequently purchased items. R `
summary(transactions) itemFrequencyPlot(transactions, topN = 10, type = "absolute", col = "steelblue", main = "Top 10 Items")
`
**Output:
Output
Output
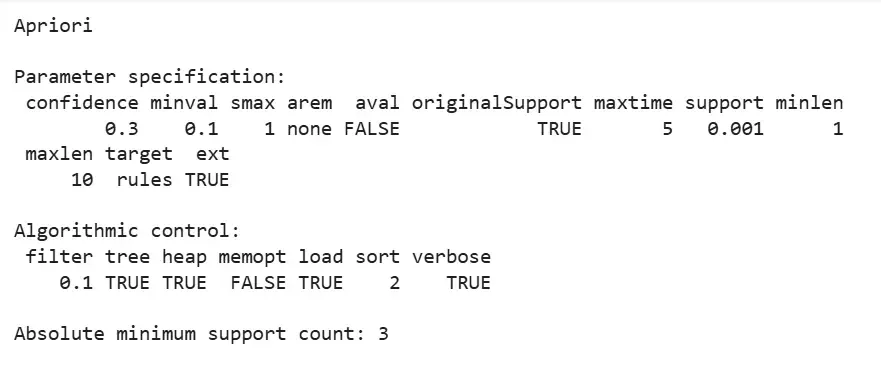
6. Running the Apriori algorithm
We generate association rules from the transaction data.
- **apriori: applies the Apriori algorithm to extract frequent itemsets and rules. R `
rules <- apriori(transactions, parameter = list(supp = 0.001, conf = 0.3))
`
**Output:
Output
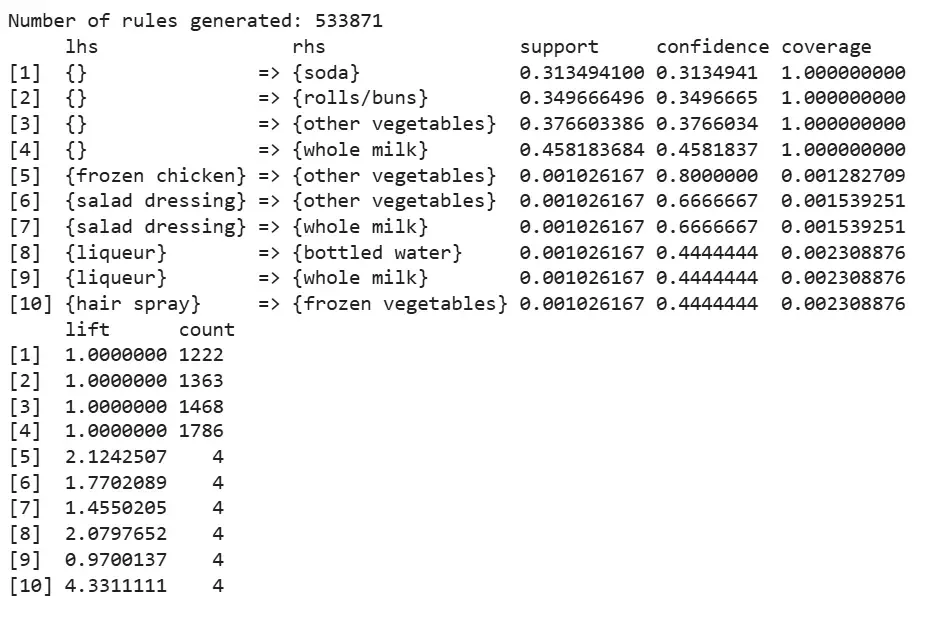
7. Displaying generated rules
We print the number of rules generated and inspect a few.
- **cat: used to print a message or value to the console.
- **length: returns the number of rules.
- **inspect: shows the details of association rules. R `
cat("Number of rules generated:", length(rules), "\n")
if (length(rules) > 0) { inspect(rules[1:min(10, length(rules))]) } else { cat("No rules were generated. Try lowering support or confidence.\n") }
`
**Output:
Output
8. Sorting and inspecting rules by lift
We sort rules to identify those with the highest lift.
- **sort(): Sorts the association rules based on a specified metric (e.g., lift).
- **inspect(): Displays the details of the selected association rules. R `
if (length(rules) > 0) { top_lift_rules <- sort(rules, by = "lift", decreasing = TRUE) inspect(top_lift_rules[1:min(10, length(top_lift_rules))]) }
`
**Output:
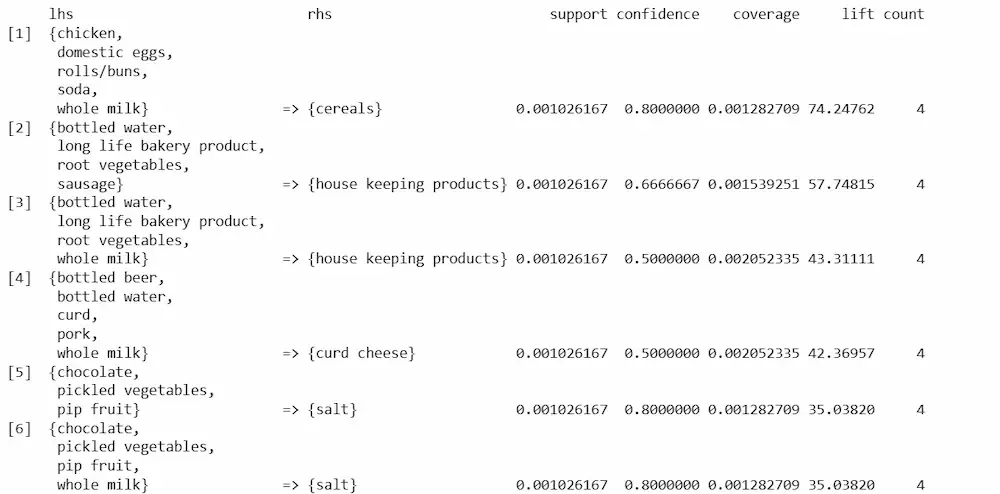
Output
9. Plotting the rules as a scatter plot
We visualize the rules by support and confidence.
- **plot (method = "scatterplot"): creates a support vs. confidence plot.
- **shading = "lift": color-encodes rules by lift value. R `
if (length(rules) > 0) { plot(rules, method = "scatterplot", measure = c("support", "confidence"), shading = "lift", main = "Scatter Plot of Association Rules") }
`
**Output:
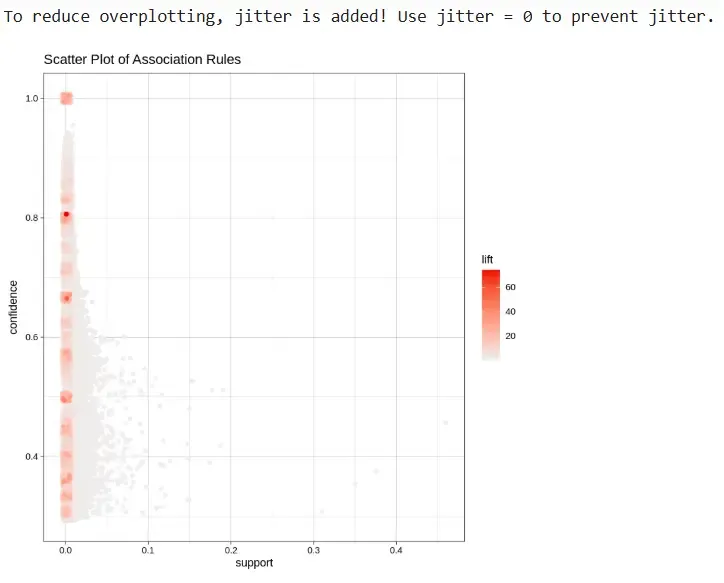
Output
Applications of Association Rule Mining
- **Market Basket Analysis: Identifies items frequently bought together in retail.
- **Product Recommendations: Suggests related products in e-commerce platforms.
- **Web Usage Mining: Analyzes user click patterns to enhance website navigation.
- **Healthcare Analytics: Finds associations between symptoms, diseases, and treatments.