Compute Cumulative Chi Square Density in R Programming pchisq() Function (original) (raw)
Last Updated : 15 Jul, 2025
**pchisq()** function in R Language is used to compute cumulative chi square density for a vector of elements. It also creates a density plot for chi square cumulative distribution.
Syntax: pchisq(vec, df)Parameters: vec: Vector of x-valuesdf: Degree of Freedom
Example 1:
Python3 1== `
R program to compute
Cumulative Chi Square Density
Create a vector of x-values
x <- seq(0, 10, by = 1)
Calling pchisq() Function
y <- pchisq(x, df = 5) y
`
Output:
[1] 0.00000000 0.03743423 0.15085496 0.30001416 0.45058405 0.58411981 [7] 0.69378108 0.77935969 0.84376437 0.89093584 0.92476475
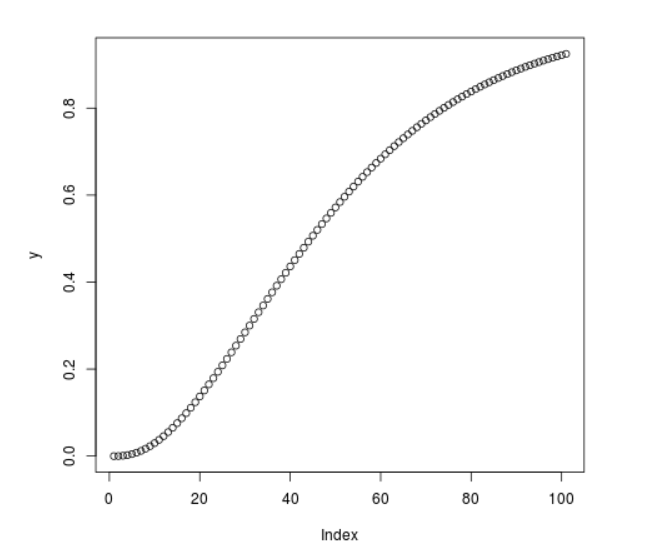
Example 2:
Python3 1== `
R program to compute
Cumulative Chi Square Density
Create a vector of x-values
x <- seq(0, 10, by = 0.1)
Calling pchisq() Function
y <- pchisq(x, df = 5)
Plot a graph
plot(y)
`
Output: