Confusion Matrix In R (original) (raw)
Last Updated : 24 Jul, 2025
A confusion matrix is a table that helps evaluate how well a classification model performs. It compares the actual values with the predicted ones, providing a detailed view of correct and incorrect classifications. The structure consists of rows for actual classes and columns for predicted classes.
The key components of a confusion matrix include:
- **True Positive (TP): Correctly predicted as positive
- **True Negative (TN): Correctly predicted as negative
- **False Positive (FP): Incorrectly predicted as positive
- **False Negative (FN): Incorrectly predicted as negative
These values help us derive performance metrics like accuracy, precision, recall and specificity.
**Creating a Confusion Matrix in R
R provides various packages for working with confusion matrices, such as caret, MLmetrics and yardstick. Below we explore creating and interpreting confusion matrices using the caret package.
**1. Binary Classification
We create a confusion matrix from actual and predicted binary class labels and evaluate model performance.
R `
install.packages("caret") library(caret)
actual <- factor(c(1, 0, 1, 1, 0, 0, 1, 0, 1, 0)) predicted <- factor(c(1, 0, 1, 1, 0, 0, 1, 0, 1, 0))
conf_matrix <- confusionMatrix(actual, predicted)
print(conf_matrix)
`
**Output:
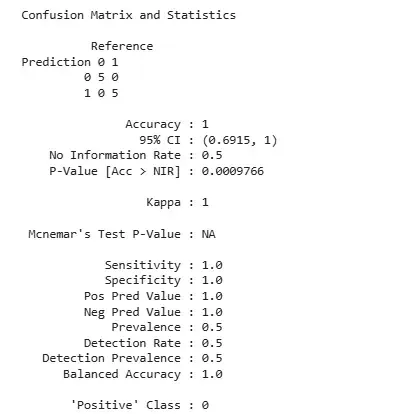
Output
The model achieved perfect classification with an accuracy of 1. All predicted labels matched the actual ones, resulting in no false positives or false negatives.
**2. Multi-class Classification
We build a classification model on the Iris dataset and evaluate its performance using a confusion matrix.
R `
library(caret)
data(iris)
set.seed(123) train_index <- createDataPartition(iris$Species, p = 0.8, list = FALSE) train_data <- iris[train_index, ] test_data <- iris[-train_index, ]
model <- train(Species ~ ., data = train_data, method = "rpart")
predicted <- predict(model, test_data)
conf_matrix <- confusionMatrix(test_data$Species, predicted)
print(conf_matrix)
`
**Output:
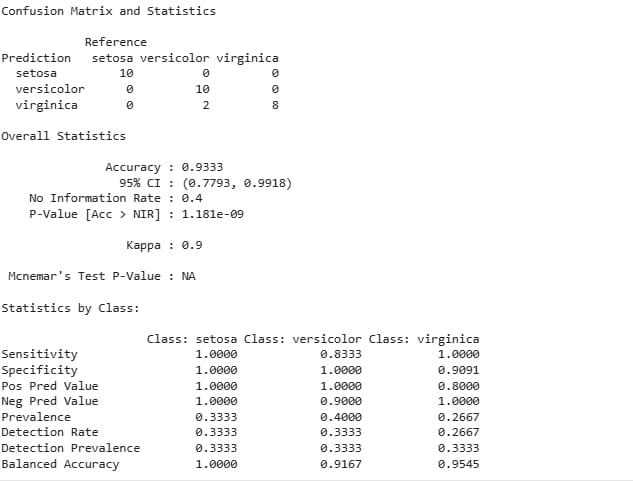
Output of Multi-class Classification
The model performs well with an accuracy of 93.33%. It perfectly classifies Setosa and Virginica but misclassifies two Versicolor instances as Virginica.
**Interpreting the Confusion Matrix
From the matrix, we calculate key performance metrics:
- **Accuracy: Overall proportion of correct predictions
- **Precision: Correct positive predictions divided by total predicted positives
- **Recall (Sensitivity): Correct positive predictions divided by total actual positives
- **Specificity: Correct negative predictions divided by total actual negatives
- **F1 Score: Harmonic mean of precision and recall
These metrics help assess how well the model generalizes and where it may need improvement.