Create a Heatmap in R Programming heatmap() Function (original) (raw)
Last Updated : 11 Jun, 2026
A heatmap is a graphical representation where values in a matrix are represented using colors. Higher values are typically shown using brighter or warmer colors (such as red), while lower values are represented using darker or cooler colors. The heatmap() function in R is used to visualize data in the form of a heatmap.
Syntax
heatmap(data)
**Parameters:
- **data: It represent matrix data, such as values of rows and columns
Create a Heatmap
In this example, number of rows and columns are specified to draw heatmap with a given function.
r `
set.seed(110)
data <- matrix(rnorm(100, 0, 5), nrow = 10, ncol = 10)
colnames(data) <- paste0("col", 1:10) rownames(data) <- paste0("row", 1:10)
heatmap(data)
`
**Output:
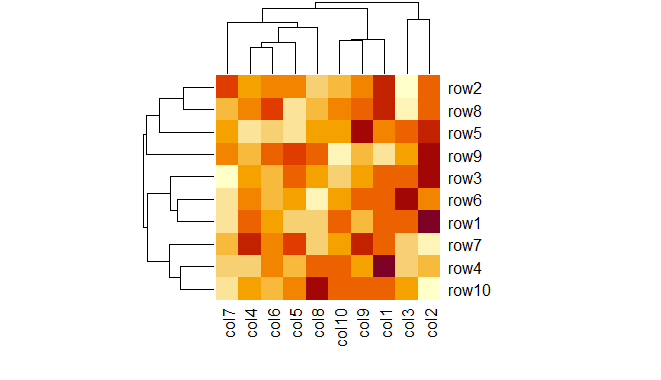
Heatmap in R Programming
Note: set.seed(110) ensures that the same random numbers are generated each time the code is run. This makes the heatmap output reproducible and consistent across executions.
Create Heatmap using colorRampPalette
In this example, heat map is drawn by using colorRampPalette to merge two different colors.
r `
set.seed(110)
data <- matrix(rnorm(100, 0, 5), nrow = 10, ncol = 10)
colnames(data) <- paste0("col", 1:10) rownames(data) <- paste0("row", 1:10)
my_colors <- colorRampPalette(c("cyan", "darkgreen"))
heatmap(data, col = my_colors(100))
`
**Output:

Heatmap in R Programming
Add Title and Axis Labels
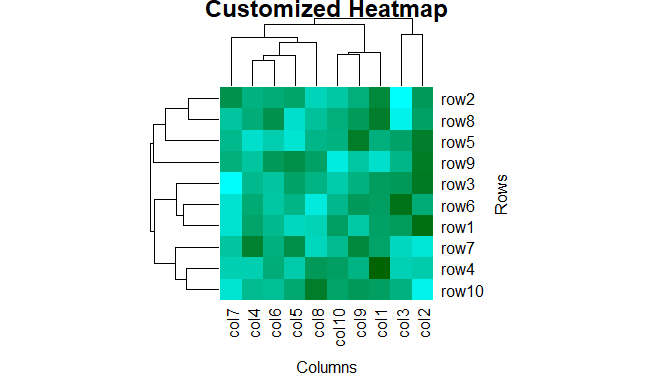
In this example we give the title of the heatmap using the main argument and the xlab ,ylab arguments are used to label the x and y axes, respectively.
R `
set.seed(110)
data <- matrix(rnorm(100, 0, 5), nrow = 10, ncol = 10)
colnames(data) <- paste0("col", 1:10) rownames(data) <- paste0("row", 1:10)
my_colors <- colorRampPalette(c("cyan", "darkgreen"))
heatmap(data, col = my_colors(100), main = "Customized Heatmap", xlab = "Columns", ylab = "Rows")
`
**Output:
Heatmap in R Programming
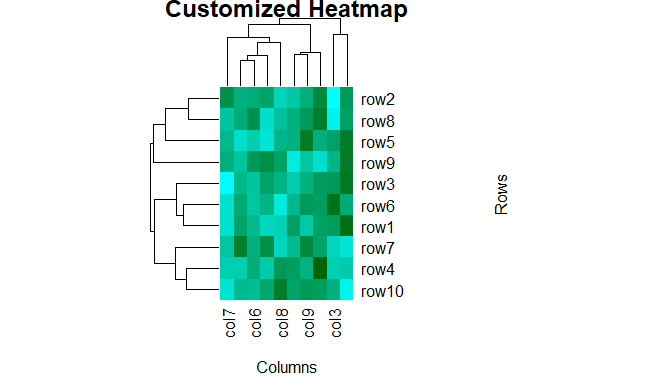
Adjust Margins Around the Plot
The margins argument controls the space around the plot. The first value (5) sets the bottom margin for column labels and the second value (10) sets the left margin for row labels.
R `
set.seed(110)
data <- matrix(rnorm(100, 0, 5), nrow = 10, ncol = 10)
colnames(data) <- paste0("col", 1:10) rownames(data) <- paste0("row", 1:10)
my_colors <- colorRampPalette(c("cyan", "darkgreen"))
heatmap(data, col = my_colors(100), main = "Customized Heatmap", xlab = "Columns", ylab = "Rows", margins = c(5, 10))
`
**Output:
Heatmap in R Programming
Heatmap without Dendrogram
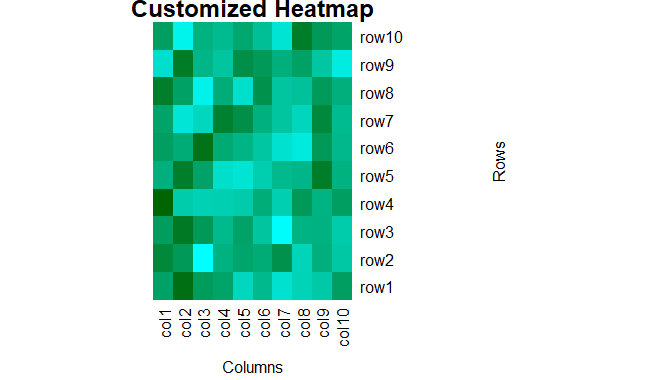
In this example we plot a heatmap without dendrograms by setting Colv = NA and Rowv = NA, which removes the hierarchical clustering and dendrogram from both rows and columns.
R `
set.seed(110)
data <- matrix(rnorm(100, 0, 5), nrow = 10, ncol = 10)
colnames(data) <- paste0("col", 1:10) rownames(data) <- paste0("row", 1:10)
my_colors <- colorRampPalette(c("cyan", "darkgreen"))
heatmap(data, col = my_colors(100), main = "Customized Heatmap", xlab = "Columns", ylab = "Rows", margins = c(5, 10), Colv = NA, Rowv = NA)
`
**Output:
Heatmap in R Programming
You can download the complete source code from here.