dplyr Package in R Programming (original) (raw)
Last Updated : 24 Jun, 2025
The dplyr package for R offers efficient data manipulation functions. It makes data transformation and summarization simple with concise, readable syntax.
Key Features of dplyr
Here are some important features of dplyr that make working with data easier.
**1. Data Frame
Data frames in dplyr in R is organized tables where each column stores specific types of information, like names, ages, or scores for creating a data frame involves specifying column names and their respective values.
R `
df <- data.frame(Name = c("vipul", "jayesh", "anurag"), Age = c(25, 23, 22), Score = c(95, 89, 78)) df
`
**Output:

A data.frame
**Note: Tibbles introduced through the tibble package, share similar functionality but offer enhanced user-friendly features. The syntax for creating a tibble is similar to that of a data frame.
**2. Pipes ( %>% )
dplyr in R The pipe operator (%>%) in dplyr package, which allows us to chain multiple operations together, improving code readability.
R `
library(dplyr)
result <- mtcars %>% filter(mpg > 20) %>% select(mpg, cyl, hp) %>% group_by(cyl) %>% summarise(mean_hp = mean(hp))
print(result)
`
**Output:

Output
Important dplyr Functions
dplyr in R provides various important functions that can be used for Data Manipulation. These are:
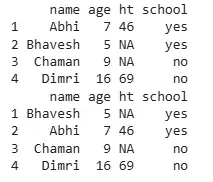
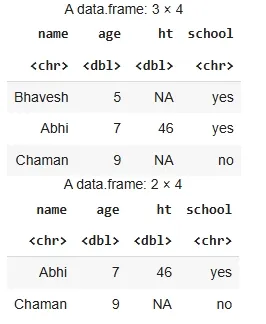
**1. filter()
For choosing cases and using their values as a base for doing so.
R `
d <- data.frame(name = c("Abhi", "Bhavesh", "Chaman", "Dimri"), age = c(7, 5, 9, 16), ht = c(46, NA, NA, 69), school = c("yes", "yes", "no", "no"))
print(d)
r_w_na <- d %>% filter(is.na(ht)) print(r_w_na)
r_w_na <- d %>% filter(!is.na(ht)) print(r_w_na)
`
**Output:

Output
**2. arrange()
For reordering of the cases.
R `
d <- data.frame( name = c("Abhi", "Bhavesh", "Chaman", "Dimri"), age = c(7, 5, 9, 16), ht = c(46, NA, NA, 69), school = c("yes", "yes", "no", "no") ) print(d)
d.name<- arrange(d, age) print(d.name)
`
**Output:
Output
**3. select() and rename()
For choosing variables and using their names as a base for doing so.
R `
library(dplyr)
d <- data.frame(name=c("Abhi", "Bhavesh", "Chaman", "Dimri"), age=c(7, 5, 9, 16), ht=c(46, NA, NA, 69), school=c("yes", "yes", "no", "no"))
d_new <- d %>% select(name, age, contains("h")) %>% rename(height = ht)
print(d_new)
`
**Output:
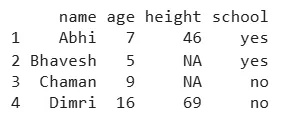
Output
**4. mutate() and transmute()
Addition of new variables which are the functions of prevailing variables.
R `
d <- data.frame(name = c("Abhi", "Bhavesh", "Chaman", "Dimri"), age = c(7, 5, 9, 16), ht = c(46, NA, NA, 69), school = c("yes", "yes", "no", "no"))
mutate(d, x3 = ht + age)
transmute(d, x3 = ht + age)
`
**Output:
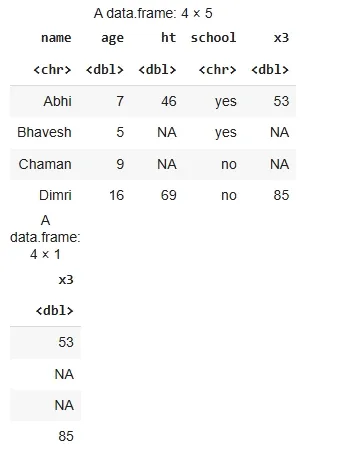
Output
**5. summarise()
Condensing various values to one value.
R `
d <- data.frame( name = c("Abhi", "Bhavesh", "Chaman", "Dimri"), age = c(7, 5, 9, 16), ht = c(46, NA, NA, 69), school = c("yes", "yes", "no", "no") )
summarise(d, mean_age = mean(age, na.rm = TRUE), min_age = min(age, na.rm = TRUE), max_age = max(age, na.rm = TRUE), median_age = median(age, na.rm = TRUE))
`
**Output:
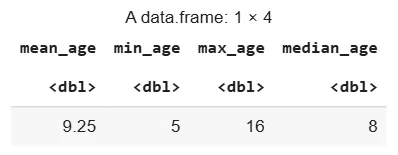
Output
**6. sample_n() and sample_frac()
For taking random specimens.
R `
d <- data.frame( name = c("Abhi", "Bhavesh", "Chaman", "Dimri"), age = c(7, 5, 9, 16), ht = c(46, NA, NA, 69), school = c("yes", "yes", "no", "no") )
sample_n(d, 3)
sample_frac(d, 0.50)
`
**Output:
Output