How to add column to dataframe in R ? (original) (raw)
Last Updated : 26 Mar, 2021
In this article, we are going to see how to add columns to dataframe in R. First, let's create a sample dataframe.
Adding Column to the DataFrame
We can add a column to a data frame using $ symbol.
syntax: dataframe_name $ column_name = c( value 1,value 2 . . . , value n)
Here c() function is a vector holds values .we can pass any type of data with similar type.
Steps for adding a column to a dataframe.
- Create a data frame.
- Use the $ symbol as shown in the above syntax to add a column to a data frame.
- Print the updated data frame to see the changes.
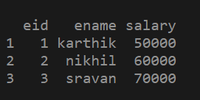
Example 1: Creating a data frame.
R `
Creating a data frame with eid , ename,salary as columns
df2 = data.frame(eid = c(1, 2, 3), ename = c("karthik", "nikhil", "sravan"), salary = c(50000, 60000, 70000))
printing the data frame
print(df2)
`
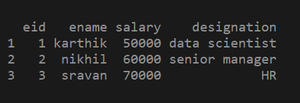
Adding a column using $ symbol:
R `
creating a data frame
df2 = data.frame(eid = c(1, 2, 3), ename = c("karthik", "nikhil", "sravan"), salary = c(50000, 60000, 70000))
adding a new column to the data frame using $ symbol
df2$designation = c("data scientist", "senior manager", "HR")
printing the updated data frame
print(df2)
`
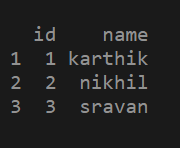
Example 2: Creating a data frame
R `
creating a data frame using vectors
df1 = data.frame(id = c(1, 2 ,3), name = c("karthik", "nikhil", "sravan"))
printing the data frame
print(df1)
`
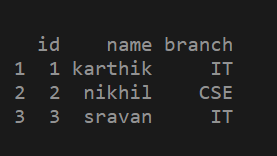
Adding a column to the data frame
R `
creating a data frame
df1 = data.frame(id = c(1, 2, 3), name = c("karthik", "nikhil", "sravan"))
adding a new column to the data frame using $ symbol
df1$branch = c("IT", "CSE", "IT")
printing the updated data frame
print(df1)
`