How to Draw Poisson Density Curve in R? (original) (raw)
Last Updated : 23 Jul, 2025
In this article, we are going to learn how to draw the Poisson density curve in the R programming language.
Function used:
dpois(): The dpois() method is used to accept the vector of quantiles and the vector of means as the input parameters. The dpois() method has the following syntax :
Syntax: dpois (q, m)
Arguments :
- q - Vector of quantiles.
- m - Vector of means.
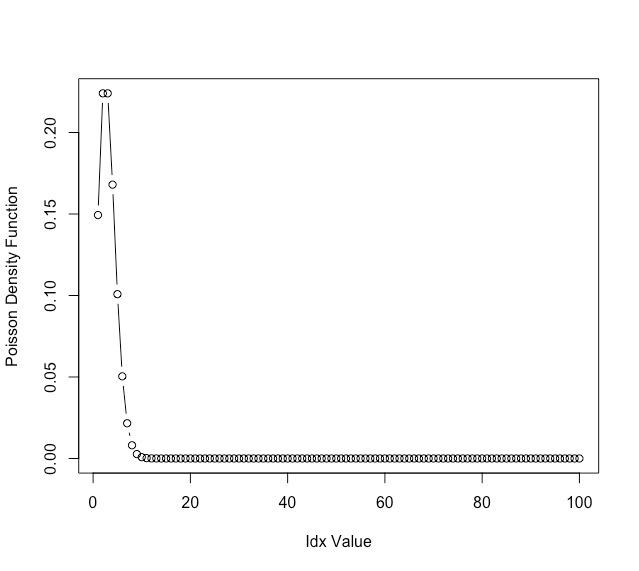
Computing Poisson density curve for vectors
To draw the Poisson density curve for vectors firstly we are declaring data points from 1 to 100 and specify the lambda value as 3 and after that using the plot() method to plot the Poisson density curve on a graph with dpois() method inside it to accept the vector quantiles.
R `
Declaring the data points
from 1 to 100
data_points <-1:100 print(data_points)
Specifying the lambda value
val <- 3
Plotting the data points
plot(dpois(x= data_points,lambda= val),type="b", xlab = "Idx Value", ylab = "Poisson Density Function")
`
Output:
> print(data_points)
[1] 1 2 3 4 5 6 7 8 9 10 11 12 13 14 15 16 17 18 19 20 21 22 23 24
[25] 25 26 27 28 29 30 31 32 33 34 35 36 37 38 39 40 41 42 43 44 45 46 47 48
[49] 49 50 51 52 53 54 55 56 57 58 59 60 61 62 63 64 65 66 67 68 69 70 71 72
[73] 73 74 75 76 77 78 79 80 81 82 83 84 85 86 87 88 89 90 91 92 93 94 95 96
[97] 97 98 99 100
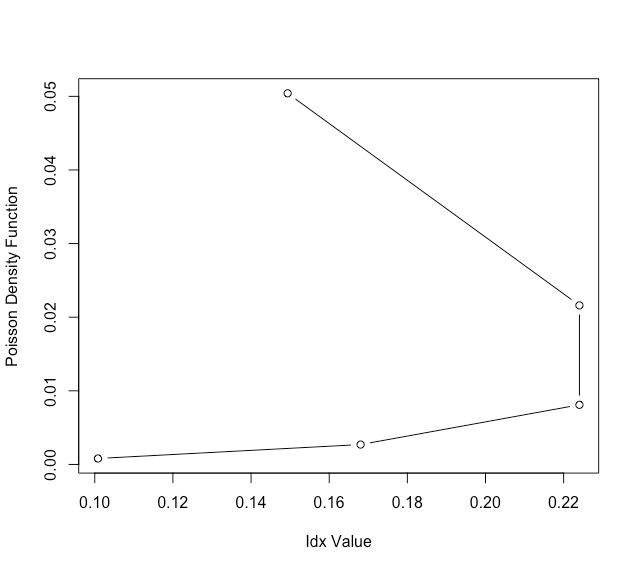
Computing the Poisson distribution function of the matrix
Here, we are creating the matrix of data points and using them to plot the Poisson density curve as same as above graph.
R `
Declaring the data points
data_points <-matrix(1:20,ncol=4) print(data_points)
Specifying the lambda value
val<- 3
Plotting the data points
plot(dpois(x= data_points,lambda= val),type="b", xlab = "Idx Value", ylab = "Poisson Density Function")
`
Output:
> print(data_points)
[,1] [,2] [,3] [,4]
[1,] 1 6 11 16
[2,] 2 7 12 17
[3,] 3 8 13 18
[4,] 4 9 14 19
[5,] 5 10 15 20