How to Use the Triangular Distribution in R (original) (raw)
Last Updated : 23 Jul, 2025
Statistical distributions are crucial for analyzing data, and the triangular distribution is especially handy for handling uncertain values with clear minimum, maximum, and peak points. In R Programming Language we can easily generate random numbers following this distribution pattern. It helps in simulating scenarios, assessing risks, and making data-driven decisions.
What is Triangular Distribution?
The triangular distribution is a type of probability distribution that represents uncertainty about an outcome where the minimum, maximum, and most likely values are known. It forms a triangle shape when plotted on a graph, with the peak of the triangle at the most likely value and the sides extending to the minimum and maximum values. It is defined by three parameters:
- **Minimum value (a): The lowest possible value that the random variable can take.
- **Maximum value (b): The highest possible value that the random variable can take.
- **Mode or peak value (c): The most likely value or the point where the distribution is at its highest.
To represent the Triangular Distribution there are multiple packages that provide functions for working with them. Two commonly used packages are:
Triangular Distribution in R using EnvStats package
We will use EnvStats package in R Programming to find Triangular Distribution.
Syntax :- **ptri(q, min = 0, max = 1, mode = 1/2)
- **q: Quantile of interest (the value at which you want to calculate the cumulative probability).
- **min: The minimum value of the distribution (default is 0).
- **max: The maximum value of the distribution (default is 1).
- **mode: The peak value of the distribution (default is 1/2). R `
library(EnvStats) library(ggplot2)
Define parameters for the triangular distribution
min_value <- 0 max_value <- 100 mode_value <- 50
Calculate cumulative probability for a quantile
quantile_of_interest <- 70 cumulative_prob <- ptri(q = quantile_of_interest, min = min_value, max = max_value, mode = mode_value) cumulative_prob
`
**Output:
[1] 0.82
min_value, max_value, mode_value , Parameters defining the Triangular Distribution. Here, min_value = 0, max_value = 100, and mode_value = 50 are used.
- The quantile (probability) of interest, set to 70 in this example.
- Calculates the cumulative probability up to the specified quantile using the ptri() function.
Create a plot to visualize the Cumulative Distribution Function
R `
Generate x values for plotting the CDF
x_values <- seq(min_value, max_value, length.out = 100) cdf_values <- ptri(q = x_values, min = min_value, max = max_value, mode = mode_value)
Create a plot to visualize the CDF
ggplot(data.frame(x = x_values, cdf = cdf_values), aes(x = x, y = cdf)) + geom_line() + geom_vline(xintercept = quantile_of_interest, linetype = "dashed", color = "red") + labs(title = "Cumulative Distribution Function (CDF) of Triangular Distribution", x = "Random Variable (x)", y = "Cumulative Probability") + theme_minimal()
`
**Output:
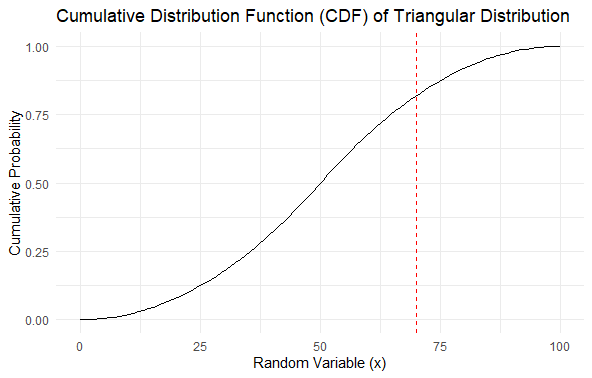
Triangular Distribution in R
Generates a sequence of x values for plotting the Cumulative Distribution Function (CDF). The length.out parameter determines the number of points in the sequence.
- Calculates the cumulative probability for each x value in the sequence using the ptri() function.
- Applies a minimalistic theme to the plot.
Triangular Distribution in R using triangle package
We will use triangle package in R Programming to find Triangular Distribution.
Syntax :- rtriangle(n, a, b, c)
- **n: Number of random numbers to generate.
- **a: Minimum value of the distribution.
- **b: Maximum value of the distribution.
- **c: Mode or peak value of the distribution. R `
library(triangle) library(ggplot2)
Define parameters for the triangular distribution
num_samples <- 1000 min_value <- 0 max_value <- 100 mode_value <- 50
Generate random numbers from the triangular distribution
random_numbers <- rtriangle(n = num_samples, a = min_value, b = max_value, c = mode_value)
Create a histogram to visualize the distribution of random numbers
ggplot(data.frame(x = random_numbers), aes(x = x)) + geom_histogram(binwidth = 5, fill = "skyblue", color = "black") + labs(title = "Histogram of Random Numbers from Triangular Distribution", x = "Random Variable (x)", y = "Frequency") + theme_minimal()
`
**Output:
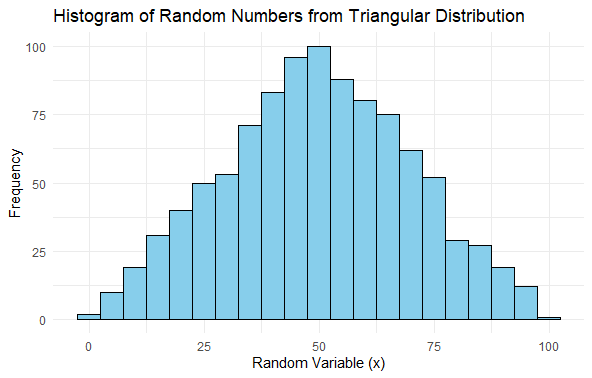
Triangular Distribution in R
Specifies the number of random numbers (samples) to generate from the triangular distribution.
- Define the parameters of the triangular distribution. Here, the minimum value is 0, the maximum value is 100, and the mode (peak) value is 50.
- Uses the rtriangle() function to generate 1000 random numbers from a triangular distribution defined by the specified parameters.
Conclusion
The Triangular Distribution is a useful probability distribution for modeling uncertain events with known minimum, maximum, and mode values. It forms a triangular shape on a graph, emphasizing the most likely outcomes.