Kurtosis in R Programming (original) (raw)
Last Updated : 11 Jul, 2025
Kurtosis measures a distribution's "tailedness," not its peakedness, compared to a normal distribution. A common misconception is that kurtosis indicates how tall or flat the peak of a distribution is. However, kurtosis measures the weight of the tails of the distribution and provides information about the presence of extreme outliers.
- **Mesokurtic: Distributions with kurtosis around 0 (i.e., the same as the normal distribution). These distributions have a moderate peak and tails.
- **Leptokurtic: Distributions with positive kurtosis (> 3). These distributions have a sharp peak and heavy tails, indicating more extreme outliers.
- **Platykurtic: Distributions with negative kurtosis (< 3). These distributions have a flatter peak and thinner tails, indicating fewer extreme outliers.
Mathematical Formula for Kurtosis
There are 3 types of kurtosis are available so we will discuss all of them.
1. Population Kurtosis
The formula for population kurtosis is defined as:
K = \frac{\mu_4}{\sigma_4}
**where:
- \mu_4 is the fourth central moment of the distribution.
- \sigma is the standard deviation of the distribution.
This formula can also be expressed as:
K = \frac{\Epsilon[(X- \mu)^4]}{(E[X-\mu]^2)^2}
**where:
- E denotes the expected value and \mu is the mean of the distribution.
2. Sample Kurtosis
For a sample, the kurtosis formula adjusts for sample size and is given by:
K = \frac{n(n-1)}{(n-2)(n-3)}. \frac{\sum(x_i - \bar{x})^4}{s^4}
**where:
- n is the sample size.
- x_i are the sample observations.
- \bar{x} is the sample mean.
- s is the sample standard deviation.
This formula accounts for bias in estimating the population kurtosis from a sample.
3. Excess Kurtosis
Excess kurtosis is often used to compare the kurtosis of a distribution to that of a normal distribution (which has a kurtosis of 3). It is calculated as:
\text{Excess Kurtosis } = K -3
This adjustment allows for easier interpretation, where a value of 0 indicates a distribution similar to normal.
Why Kurtosis is Important?
Kurtosis is essential in many statistical applications because:
- **Identifying outliers: It helps identify whether our data contains extreme values or outliers, which might need special handling.
- **Financial analysis: In finance, kurtosis is used to model the risk of extreme price movements, making it a valuable metric for portfolio management.
- **Assumption checking: In many statistical models, normality assumptions are crucial. Kurtosis helps verify the extent of deviation from normality.
Calculating Kurtosis in R
In R programming, we can calculate kurtosis using several libraries.
1. Using e1071 Package
We calculate kurtosis using the kurtosis() function from the e1071 package and visualize the distribution using ggplot2. This helps us understand the shape and outliers in our dataset compared to a normal distribution.
- **e1071: Provides the kurtosis() function for statistical computation.
- **ggplot2: A plotting system for creating histograms and density curves.
- **geom_histogram: Creates a histogram from data.
- **geom_density: Plots the estimated density curve.
- **stat_function: Adds a custom function line to the plot (like normal distribution).
- **data.frame: Converts numeric data into a format usable by ggplot2.
- **mean: Calculates average of the data.
- **sd: Calculates standard deviation. R `
install.packages("e1071") install.packages("ggplot2")
library(e1071) library(ggplot2)
data <- c(2, 3, 4, 4, 4, 5, 6, 7, 8, 9, 10)
kurt_val <- kurtosis(data) cat("The kurtosis of the dataset is:", kurt_val, "\n")
df <- data.frame(value = data)
ggplot(df, aes(x = value)) + geom_histogram(aes(y = ..density..), binwidth = 1, fill = "lightblue", color = "black") + geom_density(color = "red", size = 1) + stat_function(fun = dnorm, args = list(mean = mean(data), sd = sd(data)), color = "blue", linetype = "dashed")
`
**Output:
The kurtosis of the dataset is: -1.561636
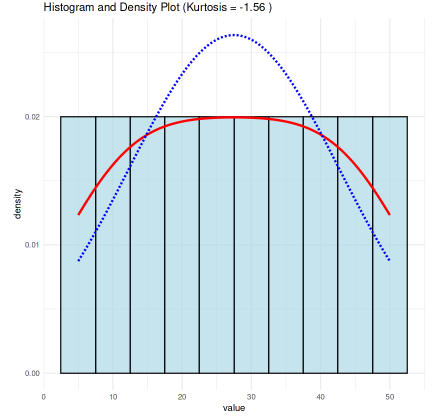
The calculated kurtosis is -1.56, which indicates the distribution is platykurtic. Platykurtic distributions (kurtosis < 3 or in this case < 0) have thinner tails and flatter peaks compared to a normal distribution. The negative kurtosis suggests our dataset is flatter and less prone to producing outliers compared to a normal distribution.
- The red density curve is flatter at the peak compared to the blue normal distribution curve, confirming the platykurtic nature of the data.
- The tails are less heavy than those of a normal distribution (seen in the blue curve), meaning there are fewer extreme values in our data.
2. Using Moments Package
We use the kurtosis() function from the moments package to calculate kurtosis and visualize it using ggplot2 for interpretation.
- **moments: Offers statistical functions including kurtosis.
- **ggplot2: Used to build plots with histogram and density overlays.
- **geom_histogram: Generates histogram bars.
- **geom_density: Adds the density line to compare distribution.
- **stat_function: Used to draw the normal curve.
- **mean, sd: Used for normal curve calculation.
- **data.frame: Converts the data to a usable format for plotting. R `
install.packages("moments") install.packages("ggplot2")
library(moments) library(ggplot2)
data <- c(4, 5, 5, 6, 6, 6, 7, 8, 10, 12, 13)
kurt_val <- kurtosis(data) cat("The kurtosis of the dataset is:", kurt_val, "\n")
df <- data.frame(value = data)
ggplot(df, aes(x = value)) + geom_histogram(aes(y = ..density..), binwidth = 1, fill = "lightblue", color = "black") + geom_density(color = "red", size = 1) + stat_function(fun = dnorm, args = list(mean = mean(data), sd = sd(data)), color = "blue", linetype = "dashed")
`
**Output:
The kurtosis of the dataset is: 1.775758
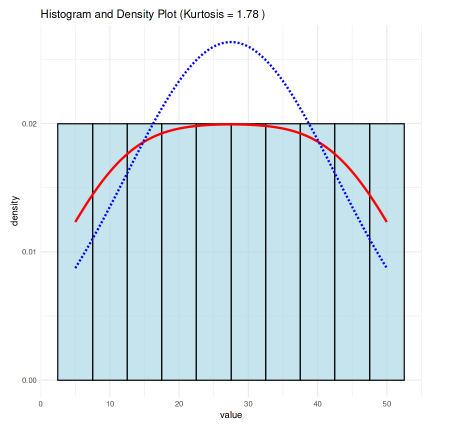
Histogram and Density Plot
A kurtosis of 1.775758 indicates that the distribution is platykurtic. This means that our dataset has lighter tails and a flatter peak compared to a normal distribution. In practical terms, this could imply fewer extreme values (outliers) and a more evenly distributed set of data points.
Applications of Kurtosis
Here are the main Applications of Kurtosis:
- **Risk Management: In finance, high kurtosis might suggest a higher risk of extreme financial losses due to the presence of outliers.
- **Quality Control: Manufacturing processes often use kurtosis to monitor the consistency of products. High kurtosis indicates a higher likelihood of defective products.
- **Machine Learning: In the preprocessing phase of machine learning, kurtosis can help detect anomalies in the dataset.