OneSample Ttest in R (original) (raw)
One-Sample T-test in R
Last Updated : 23 Jul, 2025
A statistical method for determining if a sample's mean significantly deviates from an assumed or known population mean is the one-sample t-test. In R Programming Language it can be complicated, hypothesis testing requires it. It functions by enabling analysts and researchers to extrapolate population parameters from sample data.
Mathematical Implementation
The one-sample t-test is based on the t-distribution and is commonly used when dealing with small sample sizes or when the population standard deviation is unknown. The formula for the one-sample t-test statistic is:
t= \frac{\overline{X}-μ}{s/\sqrt{n}}
**Where:
- \bar x****:** Sample mean.
- \mu****:** Hypothesized population mean.
- s****:** Sample standard deviation.
- n****:** Number of observations in the sample.
The t-test statistic measures how many standard errors the sample mean (\bar x) is away from the hypothesized population mean (\mu). A larger t-value indicates a larger difference between the sample mean and the hypothesized population mean.
The t-value calculated from your sample data will indicate how far your sample mean is from the population mean in terms of standard errors. Larger t-value places your sample mean further from the peak of the distribution, suggesting a more significant difference.
Null and Alternative Hypotheses
Before conducting a one-sample t-test, it's essential to establish the null hypothesis (H0) and the alternative hypothesis (Ha). In the context of a one-sample t-test:
- **Null Hypothesis (H_0): There is no significant difference between the sample mean and the population mean.
- **Alternative Hypothesis (H_a): There is a significant difference between the sample mean and the population mean.
p-value
The p-value is a crucial output of the one-sample t-test. It represents the probability of observing the sample mean (or something more extreme) if the null hypothesis is true. A small p-value (typically less than 0.05) suggests strong evidence against the null hypothesis, indicating that the sample mean is significantly different from the population mean.
One sample t-test in R
We are conducting research on the heights of individuals and want to determine if the sample mean height, collected from 15 individuals, significantly differs from the known population mean height of 170 cm.
1. Define Your Data
We are creating the sample data of the heights of different individuals.
R `
heights <- c(165, 168, 172, 170, 169, 171, 174, 168, 166, 170, 175, 172, 169, 167, 170)
`
2. Set Up Hypotheses
Null Hypothesis (H_0): The sample mean is equal to the known population mean (\mu).
Alternative Hypothesis (H_a): The sample mean is not equal to the known population mean (\mu).
3. Perform the One-Sample T-test
We execute the one-sample t-test in R using the t.test() function:
R `
pop_mean <- 170
result <- t.test(heights, mu = pop_mean)
`
4. Interpret the Result
The result contains the t-value, degrees of freedom and p-value:
R `
print(result)
`
**Output:
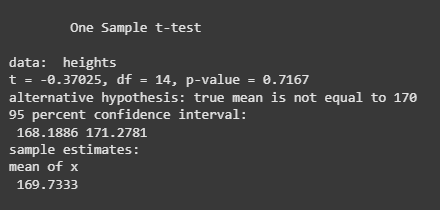
Result of One-sample T-Test
We performed a **one-sample t-test to compare the sample mean height (from 15 individuals) with the population mean of 170 cm.
- The **t-statistic is -0.37025, showing a small difference between the sample mean and 170.
- The **p-value is 0.7167, which is greater than 0.05, so we do not have enough evidence to reject the null hypothesis.
- The **95% confidence interval is [168.19, 171.28], meaning the true population mean is likely to fall within this range.
- The **sample mean is 169.73.
Overall, there is no strong evidence to suggest that the sample mean height is significantly different from 170 cm.
In this article, we explored the one-sample t-test in R, demonstrating how to compare a sample mean to a hypothesized population mean. We also discussed the steps to perform the test, interpret results like the t-statistic, p-value and confidence intervals.