Plot Cumulative Distribution Function in R (original) (raw)
Last Updated : 17 Jul, 2025
A Cumulative Distribution Function (CDF) represents the probability that a random variable takes a value less than or equal to a given number. It helps understand how values in a dataset accumulate over a range.
**Syntax:
ecdf( data_vector )
**Parameter:
- **data_vector: determines the vector that contains data for CDF calculation.
1. Using Base R
To plot a CDF in R programming language, we first calculate it using the ecdf() function and then display it using the plot() function.
**Syntax:
plot(CDF)
**Parameter:
- **CDF: The result of the ecdf() function representing the CDF of the dataset.
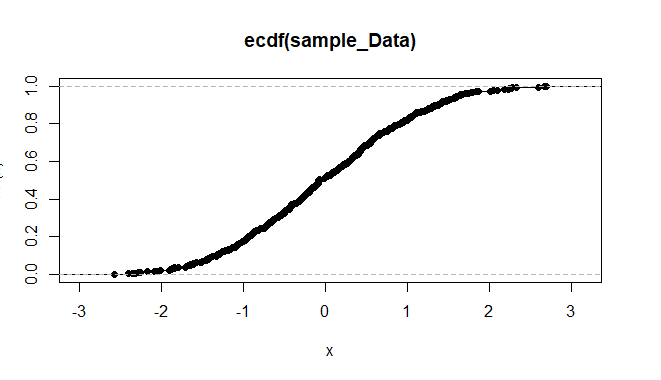
**Example 1: We plot the CDF of 500 random numbers
- **sample_Data: A numeric vector generated using rnorm().
- **ecdf(sample_Data): Computes the cumulative probabilities.
- **plot(CDF): Plots the CDF curve. R `
sample_Data <- rnorm(500) CDF <- ecdf(sample_Data) plot(CDF)
`
**Output:
Cumulative Distribution Function in R
**Example 2: We plot the CDF of Petal.Length from the iris dataset
- **data(iris): Loads the built-in dataset.
- **iris$Petal.Length: Numeric column to be plotted.
- **ecdf(iris$Petal.Length): Computes cumulative distribution.
- **plot(...): Displays the CDF plot. R `
data(iris) plot(ecdf(iris$Petal.Length))
`
**Output:

Cumulative Distribution Function in R
2. Plotting CDF of a Known Distribution
To plot the CDF of a standard distribution, we use the curve() function along with a probability function like pnorm.
**Syntax:
curve( expression, from, to )
**Parameters:
- **expression: determines the expression function for CDF calculation.
- **from: determines the lower limit of data.
- **to: determines the upper limit of data.
**Example: We plot the CDF of a normal distribution from -10 to 10.
- **pnorm: The CDF of a normal distribution.
- **from = -10, to = 10: X-axis limits for the curve. R `
curve(pnorm, from = -10, to = 10)
`
**Output:

Cumulative Distribution Function in R
3. Plotting CDF Using ggplot2
We can also use the ggplot2 package to create styled CDF plots using stat_function().
**Syntax:
plot + stat_function( fun )
**Parameters:
- **fun: determines the function for the shape of the plot.
**Example: We create a CDF plot for the normal distribution using ggplot2.
- **library(ggplot2): Loads the ggplot2 package.
- **sample_limit: Defines the range of x values.
- **stat_function(fun = pnorm): Draws the normal CDF.
- **theme_minimal(), labs(): Customizes style and labels. R `
install.packages("ggplot2") library(ggplot2)
sample_limit <- data.frame(x = c(-10, 10))
ggplot(sample_limit, aes(x = x)) + stat_function(fun = pnorm, color = "skyblue", size = 2) + theme_minimal() + labs( title = "Cumulative Distribution Function (CDF) Plot", x = "X-axis", y = "Cumulative Probability", caption = "Created with ggplot2" )
`
**Output:

Cumulative Distribution Function in R
This plot displays the cumulative distribution function of a normal distribution using ggplot2, with a styled curve, custom labels and a minimal visual theme.