Random Forest Approach in R Programming (original) (raw)
Last Updated : 27 Jun, 2025
Random Forest is an machine learning algorithm which is used for both regression and classification tasks. It is an ensemble method that creates multiple decision trees and combines their outputs to improve model performance.
Key points about Random Forest
- **Bagging (Bootstrap Aggregating): This method reduces variance by generating multiple datasets through sampling with replacement.
- **Random Feature Selection: During the construction of each decision tree, only a subset of features is considered for splitting at each node, reducing the correlation between trees and improving accuracy.
The result is concluded either by:
- **Majority Voting: For classification, where the class with the majority vote is selected.
- **Averaging: For regression, where the average prediction from all trees is used.
Working of Random Forest Algorithm
The Random Forest algorithm operates on two key principles:
- **Bootstrap Sampling: Random subsets of the training data are created by sampling with replacement.
- **Tree Construction: For each subset, a decision tree is constructed, considering only a random subset of features for splitting at each node.
- **Aggregation of Predictions: Once the trees are built, their predictions are aggregated using majority voting (for classification) or averaging (for regression).
This combination of decision trees helps to reduce overfitting and improves model accuracy.
Example
Consider a Fruit Box consisting of three fruits Apples, Oranges, and Cherries in training data (n = 3). We are predicting the fruit which is maximum in number in a fruit box. A random forest model using the training data with a number of trees, k = 3.

Working of Random Forest
The model is judged using various features of data like diameter, color, shape and groups. Among orange, cheery, and orange, orange is selected to be maximum in fruit box by random forest.
Implementing Random Forest in R
We will now implement a Random Forest model using the famous iris dataset. This will help us understand how to build and evaluate a Random Forest model in R.
1. Installing the Required Package
To implement Random Forest in R, we first need to install the **randomForest package. This package provides a simple interface for training and evaluating Random Forest models.
- **install.packages(): Installs the **randomForest package.
- **library(): Loads the package so we can use its functions. R `
install.packages("randomForest")
library(randomForest)
`
2. Loading the Dataset
We will use the iris dataset which contains data on three species of iris flowers, with measurements of sepal length, sepal width, petal length, and petal width. It is an in-built dataset in R. We will then display some of its first few rows using the **head() function.
R `
data(iris) head(iris)
`
**Output:
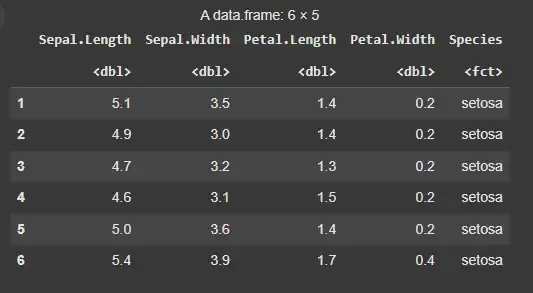
Iris Dataset
3. Splitting the Data
We will now split the data into training and testing sets. The **sample() function is used to split the data into training and testing sets.
R `
set.seed(42)
trainIndex <- sample(1:nrow(iris), 0.8 * nrow(iris))
trainData <- iris[trainIndex, ] testData <- iris[-trainIndex, ]
`
4. Training the Random Forest Model
Now, we will build the Random Forest model using the training data. The **randomForest() function creates a Random Forest model. It takes the formula target ~ features and a data frame as input. In this case, the model based on the **Species as the target variable and all other variables as features.
R `
rf_model <- randomForest(Species ~ ., data = trainData) print(rf_model)
`
**Output:

RandomForest Model
5. Evaluating the Model
We can evaluate the model’s performance by making predictions on the test data and comparing them to the true values.
- **predict(): generates predictions for the test data.
- **confusionMatrix(): evaluates the accuracy of the model by comparing predictions with actual values.
The confusion matrix will show how well the model performed, providing metrics such as accuracy, precision, recall and F1 score. We will use **caret library to plot the confusion matrix for our model.
R `
install.packages("caret") library(caret)
predictions <- predict(rf_model, testData) confusionMatrix(predictions, testData$Species)
`
**Output:
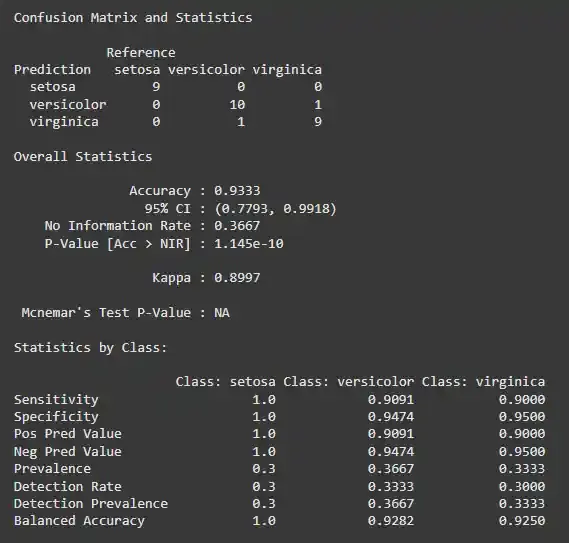
confusion matrix
Hyperparameter Tuning
The performance of Random Forest can be improved by tuning hyperparameters. We will now explore how to tune the key hyperparameters of the Random Forest model to improve its performance.
Key Hyperparameters:
- **ntree: The number of trees to grow in the forest. A higher number of trees usually results in better performance.
- **mtry: The number of features to consider for each split. Tuning this parameter can help achieve a better balance between bias and variance.
**Example:
In this example, we’ve set the number of trees (**ntree) to 500 and used 2 features (**mtry) at each split.
R `
rf_tuned <- randomForest(Species ~ ., data = trainData, ntree = 500, mtry = 2) print(rf_tuned)
`
**Output:
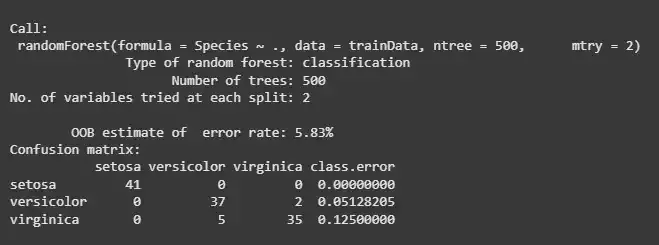
Hyperparameter Tuning
Interpreting Results and Model Evaluation
We will now interpret the results of the Random Forest model. One useful feature of Random Forest is feature importance, which shows how important each feature is in predicting the target variable.
Key functions:
importance(): This function shows the importance of each feature used in the model. It provides a numerical ranking of each feature’s importance.varImpPlot(): It creates a plot to visually represent the importance of each feature, helping us understand which features contribute the most to the model’s decision-making process.
This helps in identifying which features contribute the most to the model’s decision-making process.
R `
importance(rf_model) varImpPlot(rf_model)
`
**Output:
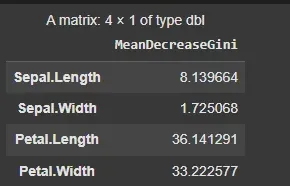
importance
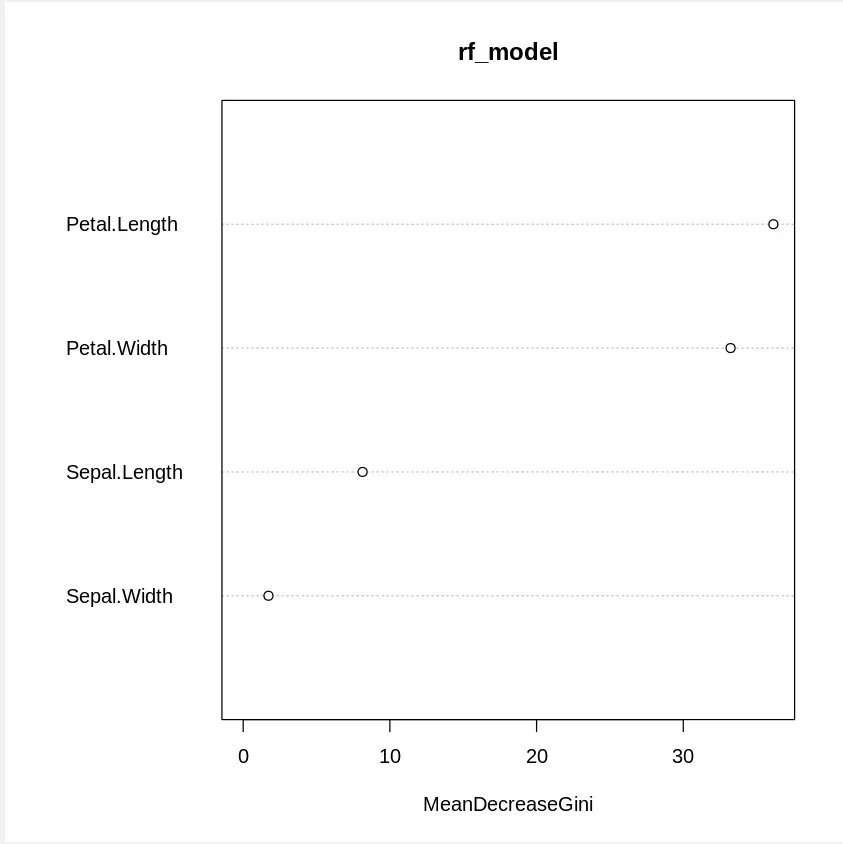
varImpPlot
Advantages of Random Forest
- **Reduced Overfitting: Due to the ensemble nature of the algorithm, it is less likely to overfit compared to individual decision trees.
- **Handles Missing Data: Random Forest can handle missing values and still perform well on the data.
- **Flexible for Different Tasks: It can be used for both classification and regression tasks, making it versatile.
- **Feature Importance: Random Forest provides insights into which features are most important for predictions.
In this article, we explored the Random Forest and learned how it works by constructing multiple decision trees and aggregating their predictions to enhance accuracy.