Stock Data Analysis and Data Visualization with Quantmod in R (original) (raw)
Last Updated : 30 Apr, 2025
The **quantmod package (Quantitative Financial Modelling Framework) is designed to assist quantitative traders and analysts in modeling, testing, and visualizing financial data. It provides tools to easily retrieve stock data from online sources like Yahoo Finance and includes functions for charting, calculating technical indicators, and managing time series data.
1. Loading the Required Package
We start by loading the quantmod package, which allows users to retrieve and analyze financial data from public sources like Yahoo Finance.
R `
install.packages("quantmod") library(quantmod)
`
2. Downloading Stock Data
We retrieve stock data for a company (Example: Zomato as ZOMATO.NS) using the **getSymbols() function. By default, data is pulled from Yahoo Finance, which contains columns such as Open, High, Low, Close, Volume, and Adjusted prices.
R `
getSymbols("ZOMATO.NS", src = "yahoo")
`
**Output:
'ZOMATO.NS'
3. Visualizing Historical Prices
We can visualize the price movement over time using the chartSeries() function. This creates a basic line chart of the historical adjusted closing prices.
R `
options(repr.plot.width = 14, repr.plot.height = 8)
chartSeries(ZOMATO.NS, theme = chartTheme("black"), type = "line")
`
**Output:

Zomato Stock Price Chart
4. Adding Moving Averages
We can analyze trends by adding moving averages. Moving averages smooth out short-term price fluctuations and help identify trend direction. The **addSMA() function adds **Simple Moving Averages (SMA) to the price chart. A **20-day SMA captures short-term trends, while a **50-day SMA reflects longer-term movements. When the short-term average crosses above the long-term average, it may indicate a bullish trend, and vice versa.
R `
options(repr.plot.width = 14, repr.plot.height = 8) chartSeries(ZOMATO.NS, theme = chartTheme("black"), TA ="addSMA(n=20,col='blue') ; addSMA(n=50,col='red')")
`
**Output:

Moving Averages
5. Summary of Recent Price Data
We can view the latest records of stock data to observe recent performance. using the head() and **tail() functions. These functions display the first and last few rows of the data, helping us understand the historical and recent trends.
R `
print("Staring price of the stock") head(ZOMATO.NS) print("----------------------------------------------------") print("Latest price of the stock") tail(ZOMATO.NS)
`
Output:
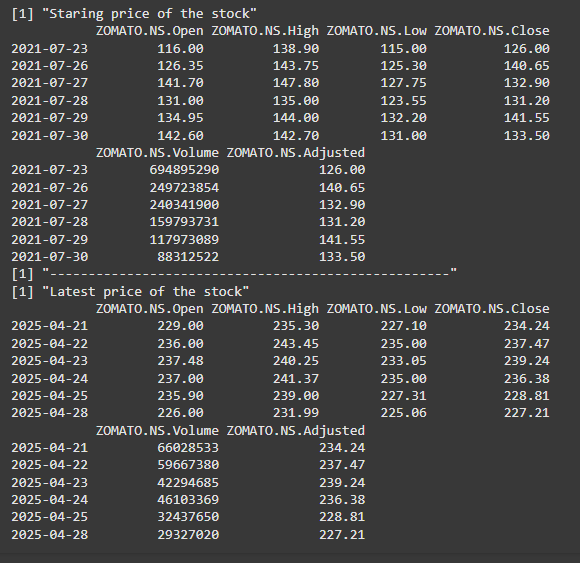
Historical and Latest prices of the stock
6. Analyzing Price Change
We compute daily returns to analyze how the stock price has changed over time. Here, we extract the closing prices with Cl(ZOMATAO.NS) and calculate daily returns using dailyReturn(). Plotting these returns helps visualize volatility.
R `
daily_returns <- dailyReturn(Cl(ZOMATO.NS)) plot(daily_returns, main = "Daily Returns of ZOMATO.NS")
`
**Output:
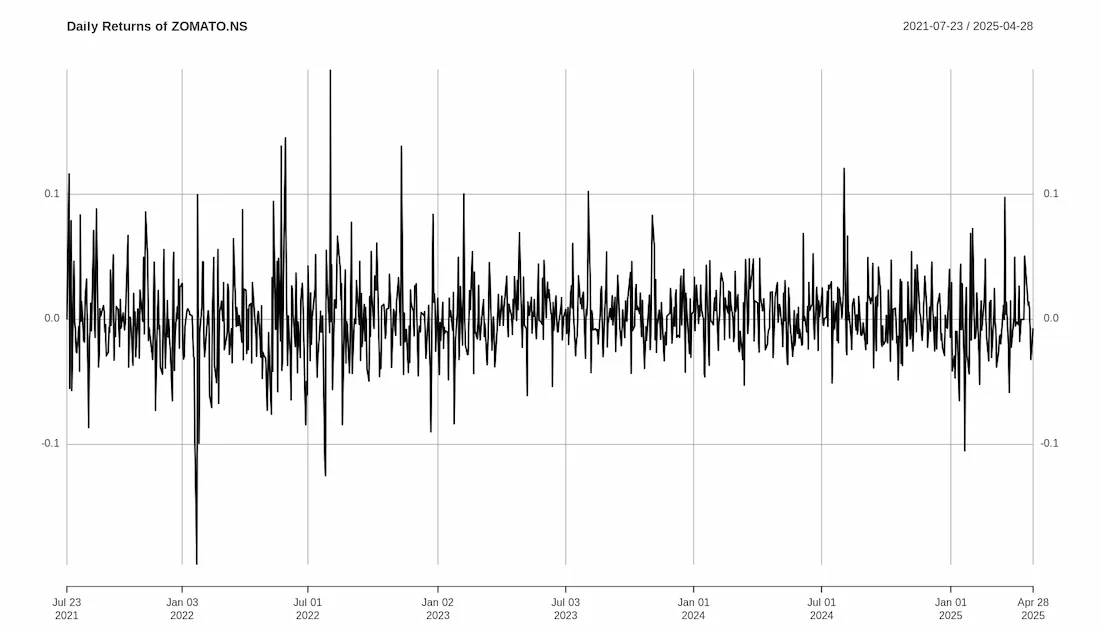
Volatility of the stock prices
From the analysis, we can conclude the following:
- The use of simple moving averages helps in understanding short- and long-term trends in the stock's price.
- Historical price plots provide insights into how the stock has performed over time.
- Daily returns highlight the stock’s day-to-day volatility, which is essential for risk evaluation.
This article demonstrated how to perform stock data analysis in R using the quantmod package. We retrieved historical data, visualized stock prices, added moving averages for trend analysis, and examined daily returns. These steps form the basis of a simple, yet structured, stock price analysis workflow in R.