Top 15 R Libraries for Data Science in 2025 (original) (raw)
When talking about **Data Science, it is impossible not to talk about R. Many R libraries contain an extensive array of functions, tools, and methods for managing and analyzing data. Each library has a specific focus, catering to different needs, such as image and text data handling, data manipulation, data visualization, web scraping, machine learning, and more.
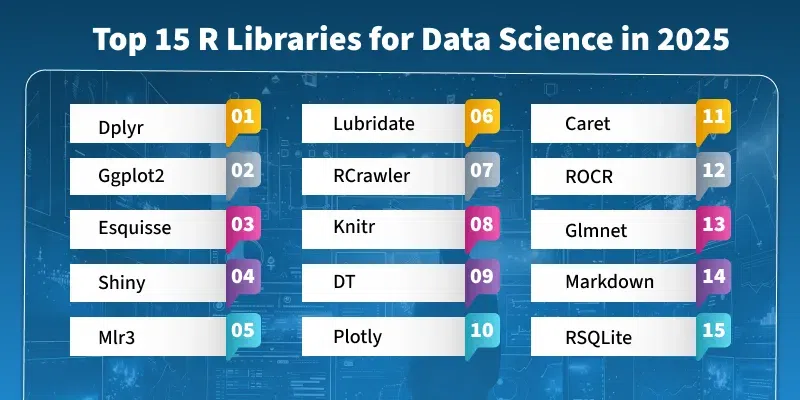
R Libraries for Data Science
This article explores the **Top 15 R libraries that are essential for data science in 2025, highlighting their key features and use cases.
Overview of Top R Libraries for Data Science
Whether you are a seasoned data scientist or just starting your journey, these libraries will provide you with the tools you need to handle tough data problems. Here’s a streamlined list of the Top R libraries for Data Science, along with brief descriptions of their functionalities and uses:
1. dplyr
One of the most widely used libraries for data manipulation, **dplyr streamlines working with data frames and allows users to perform various data wrangling operations. It provides a set of core functions that make data wrangling faster and more intuitive. These functions can also be combined with the group_by() function to perform operations on grouped data.
**Key Features of dplyr:
- **mutate(): Adds new columns based on existing data, allowing for easy feature engineering.
- **select(): Picks specific columns by name, making it easy to focus on the most relevant data.
- **filter(): Filters rows based on logical conditions, enabling you to subset your data quickly.
- **summarise(): Reduces a dataset to summary statistics, great for aggregation and descriptive analysis.
- **arrange(): Orders rows based on column values, simplifying sorting.
**Best for : Data wrangling, filtering, and summarization
2. ggplot2
ggplot2 is an R data visualization library that is based on **The Grammar of Graphics. ggplot2 can create data visualizations such as bar charts, pie charts, histograms, scatterplots, error charts, etc. using high-level API. It also allows you to add different types of data visualization components or layers in a single visualization. Once ggplot2 has been told which variables to map to which aesthetics in the plot, it does the rest of the work so that the user can focus on interpreting the visualizations and take less time to create them.
**Key Features:
- Easily combine different elements (geoms, stats, scales) in a single plot.
- ggplot2 provides a flexible framework for styling and customizing plots.
- Automatically maps data to visual properties like size, color, and shape.
- Easily create multiple plots based on a factor variable, making it simple to visualize subgroup differences.
**Best for : Creating complex, customizable plots
3. Esquisse
Esquisse is a data visualization tool in R that allows you to create detailed data visualizations using the ggplot2 package. You can create all sorts of scatter plots, histograms, line charts, bar charts, pie charts, error bars, box plots, multiple axes, sparklines, dendrograms, 3-D charts, etc. using Esquisse and also export these graphs or access the code for creating these graphs. Esquisse is such a famous and easily used data visualization tool because of its drag-and-drop ability which makes it popular even among beginners.
**Key Features:
- Drag-and-drop functionality for easy chart creation
- Supports multiple chart types (scatter, bar, line, etc.)
- Export visualizations and view underlying code
**Best for : Easy and quick visualizations for beginners
4. Shiny
Shiny is an R package that can be used to build interactive web applications in R. Basically, Shiny gives a combination of R and the modern web. And you can easily create web applications using Shiny without needing any special web development skills. Using Shiny, you can embed web applications in R documents, create standalone applications on a webpage, or even create web visualization dashboards. You can also deploy the Shiny app to the cloud or on your servers with an open-source or commercial license.
**Key Features:
- Build interactive web apps easily
- Embed apps in R documents or host on the web
- Extend functionality with HTML, CSS, and JavaScript
**Best for : Building interactive dashboards and web apps
5. mlr3
mlr3 is an R tool created specifically for Machine Learning. You can implement various Supervised and Unsupervised Machine learning models on Scikit-learn like Classification, Regression, Support Vector Machine, Random Forests, Nearest Neighbors, Naive Bayes, Decision Trees, Clustering, etc. with mlr3. It is also connected to the OpenML R package which is dedicated to supporting machine learning online.
**Key Features:
- Supports a wide range of machine learning models
- Integration with OpenML for online resources
- Improved functionality over its predecessor, mlr
**Best for : Implementing machine learning algorithms with hyperparameter tuning
6. Lubridate
Lubridate is an R library that is particularly focused on making date-time easy to handle. Working with date-time data can be frustrating with R because R commands are unintuitive for this type of data and can change based on the type of date-time object. There are many new time span classes in Lubridate as well that help in handling mathematical operations.
**Key Features:
- Simplifies date-time manipulation with intuitive functions
- Handles components like seconds, minutes, and years easily
- Offers time span classes for mathematical operations
**Best for : Parsing, manipulating, and converting date-time formats
7. RCrawler
RCrawler is an R package for domain-based web crawling and web scraping which involves obtaining structured data from websites that can be used in multiple applications. RCrawler is involved in web structure mining, text mining, web content mining, etc. Rcrawler can automatically move across all the pages on a website and extract all data that is required from these web pages using a single command.
**Key Features:
- Automated web crawling to gather structured data
- Single command to extract data from multiple pages
- Efficient parallel processing with concurrent nodes
**Best for : Automated web crawling and scraping
8. knitr
Knitr is like a helpful tool for R users who want to create dynamic reports. It lets you mix different types of code (like Markdown, LyX, LaTeX, AsciiDoc, and HTML) right into your R code. This is super handy for researchers who need to turn their data analysis into a report. Knitr makes the whole process smoother and more automated. It's an upgrade from Sweave, another R function, fixing some issues it had.
**Key Features:
- Combines code and text for dynamic reporting
- Supports multiple document formats (HTML, PDF, etc.)
- Streamlines the reporting process for researchers
**Best for : Creating dynamic reports and documents (HTML, PDF, etc.)
9. DT
DT is an R package that provides an interface to the JavaScript library DataTables that can be used to display R matrices and data frames in the form of tables. The most important function in DT is datatable() as it can create a data table to display the R objects. You can also style your tables in DT using the CSS classes.
**Key Features:
- Creates interactive tables with sorting and searching
- Integrates seamlessly with R data frames and matrices
- Customizable with CSS for styling
**Best for: Displaying data frames in a searchable, interactive table format
10. Plotly
Plotly is a cool tool for making graphs without spending any money. It's open-source and works with R. Think of it as an R package that sits on top of the Plotly JavaScript library. This combo lets you whip up data visualizations that you can show off in Jupyter notebooks, web apps (thanks to Dash), or keep as standalone HTML files. Plotly gives you over 40 types of charts, from basic stuff like scatter plots to more fancy ones like 3-D charts and even contour plots, which not every graphing tool has.
**Key Features:
- Supports over 40 types of charts and visualizations
- Open-source and integrates with R
- Easy to share in various formats (HTML, Jupyter notebooks)
**Best for: Creating interactive charts and visualizations for reports
11. caret
caret is a tool designed for regression analysis and classification. It revolves around a key function called 'train,' which explores the impact of resampling on tuning parameters for model performance. Caret is adept at working with a wide range of algorithms in both regression and classification scenarios. Additionally, it generates tables and plots, providing valuable insights and support during the model training process.
**Key Features:
- Supports multiple algorithms for regression and classification
- Generates insightful tables and plots during training
- Facilitates model tuning and evaluation with resampling
**Best for: Training and evaluating classification and regression models
12. ROCR
ROCR in R is a valuable package designed for evaluating and visualizing the performance of classification models. It specializes in creating essential metrics like ROC curves (Receiver Operating Characteristic) and precision-recall curves to provide a clear assessment of model accuracy and effectiveness. Utilize ROCR to enhance the visual representation and understanding of classification model quality. ROCR is a helpful tool in evaluating how well classification models work.
**Key Features:
- Generates ROC and precision-recall curves for model evaluation
- User-friendly interface for easy analysis
- Provides clear insights into model performance
**Best for: Visualizing performance of classification models (ROC curves, etc.)
13. Glmnet
glmnet is a widely-used R package for building regression models with regularization techniques like LASSO and elastic-net. It helps in selecting important variables, preventing overfitting, and making linear and logistic regression models more understandable and effective. glmnet's flexibility extends to various types of regression tasks, making it a versatile tool for data analysts.
**Key Features:
- Implements LASSO and elastic-net regularization
- Aids in variable selection and reduces overfitting
- Versatile for various regression tasks (linear and logistic)
**Best for: Preventing overfitting in regression models
14. Markdown
Markdown simplifies the process of creating dynamic documents by seamlessly blending code, text, and visual elements within a single document. With support for multiple output formats such as HTML, PDF, and Word, it empowers users to generate reproducible research and reports effortlessly.
**Key Features:
- Blends code, text, and visuals in one document
- Supports various output formats (HTML, PDF, Word)
- Facilitates reproducible research and reporting
**Best for : Reproducible research, mixing code, text, and visuals
15. RSQLite
RSQLite is like a helpful tool for R users who want to work with SQLite databases. It lets you easily manage, ask questions, and change SQLite databases directly from your R program. RSQLite makes dealing with databases in R simpler and smoother for data scientists and analysts. If you want to get RSQLite, just use 'install.packages("RSQLite")' from CRAN.
**Key Features:
- Simplifies database management within R
- Allows direct querying of SQLite databases
- Enhances data handling capabilities for R users
**Best for: Managing SQLite databases directly within R
Conclusion
R is a great language for Data Science. It has many useful tools, like dplyr, ggplot2, Shiny, mlr3, and more, that help with tasks like working with data, creating visuals, and building machine learning models. Even though Python is a strong competitor, R's active community and powerful libraries make it a top choice. Whether you're just starting or an expert, these R packages make data science tasks easier, from analyzing and visualizing data to developing models. Tools like RSQLite also make managing databases in R simpler, making the overall data science experience smooth and comprehensive.