3D Plots in MATLAB (original) (raw)
Last Updated : 9 May, 2021
In MATLAB, we can plot different types of modules like 2d plotting and 3d plotting. In this article, we will see what are the various types of 3D plotting.
- Mesh Plot: A mesh plot is a 3d surface that creates different types of meshes for different types of expression. To create mesh we have to give the values x and y for z, (z= f(x, y)). For plotting the mesh plot it has mesh() which will generate the 3d surface. It has solid edge color but no face color.
Syntax:
mesh(Z)
Example:
Matlab `
% give the input of x and y. [x,y]= meshgrid(0:0.1:5);
% give the expression for x % and y for the output in z z= sin(x).*cos(y);
% mesh() is used for 3D plotting mesh(z);
`
Output:

- Surface plot: A surface plot is a 3d surface that creates different types of surfaces for different expressions. To create a surface we have to give the values x and y for z, (z= f(x, y)). For plotting the surface plot it has surf() which will generate the 3d surface. It has solid edge color and solid face color
Syntax:
surf(Z)
Example:
Matlab `
% give the input for x and y [x,y]= meshgrid(0:0.1:5);
% give the expression for % x and y for the value of z. z= sin(x).*cos(y);
% use surf() for the plotting surf(z)
`
Output:

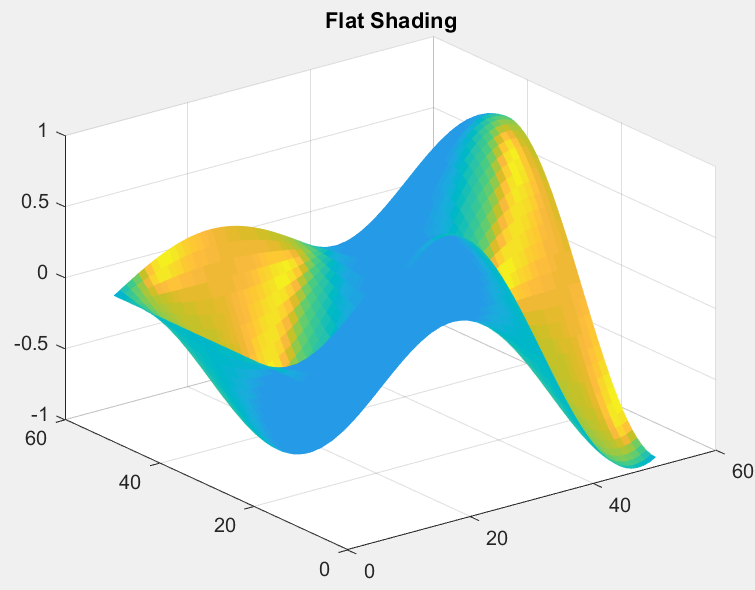
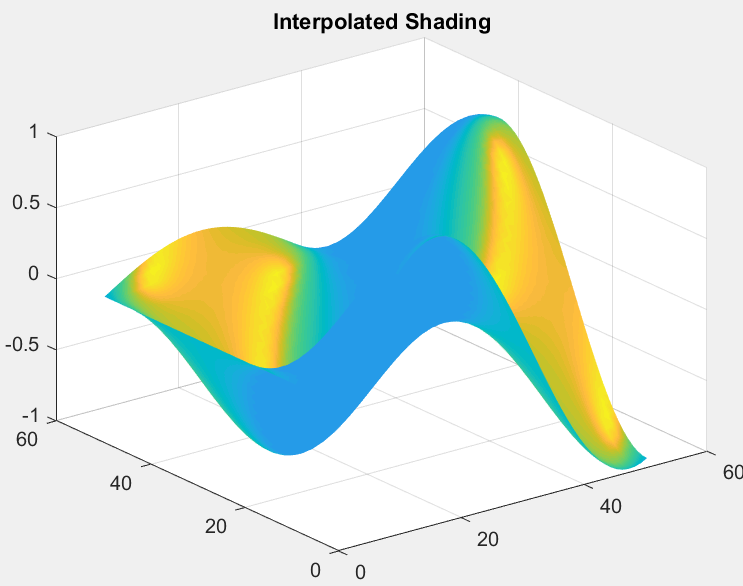
- Surface plot(with shading): A surface plot that creates a three-dimensional surface plot that has solid edge colors and solid face colors and also has shading. In surface with shading, we have to give the values x and y for z, (z= f(x, y)). For plotting the surface plot it has surf(z) is used for 3d plotting.
Syntax:
surfl(z)
There are three types of shading available:
- shading flat
- shading faceted
- shading interp
Example:
Matlab `
% give the input for x and y [x,y]= meshgrid(0:0.1:5);
% give the expression for x and y % for the value of z z= sin(x).*cos(y);
% use surfl() for the plotting % shading faceted is by default surfl(z) shading faceted title('Faceted Shading')
% use shading flat for each mesh % line segment and face has a % constant color surfl(z) shading flat title('Flat Shading')
% use shading flat for varies the % color in each line segment and % face by interpolating surfl(z) shading interp title('Interpolated Shading')
`
Output:

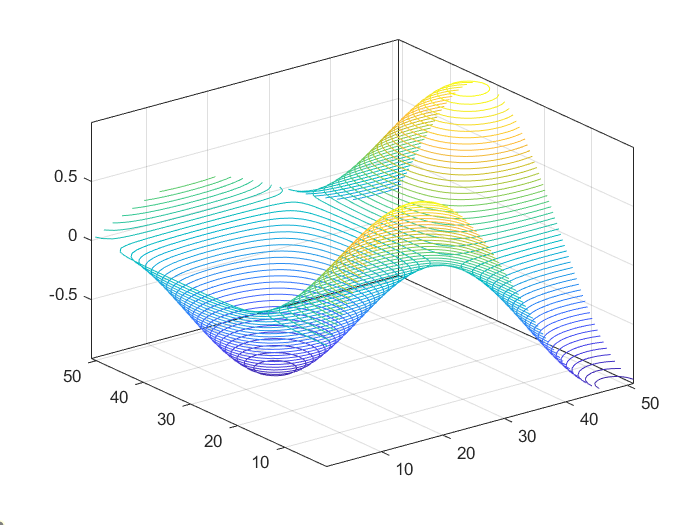
- Contour plot: A contour plot is also called a line plot. To plot contour it has x, y variables which are used to give the values for z, (z=f(x, y)). The x and y variables are usually in a grid called meshgrid.
Syntax:
contour(Z)
Example:
Matlab `
% enter the inputs of x and y [x,y]= meshgrid(0:0.1:5);
% enter the expression using % x and y z= sin(x).*cos(y);
% use contour() for plotting contour3(z,50)
`
Output:
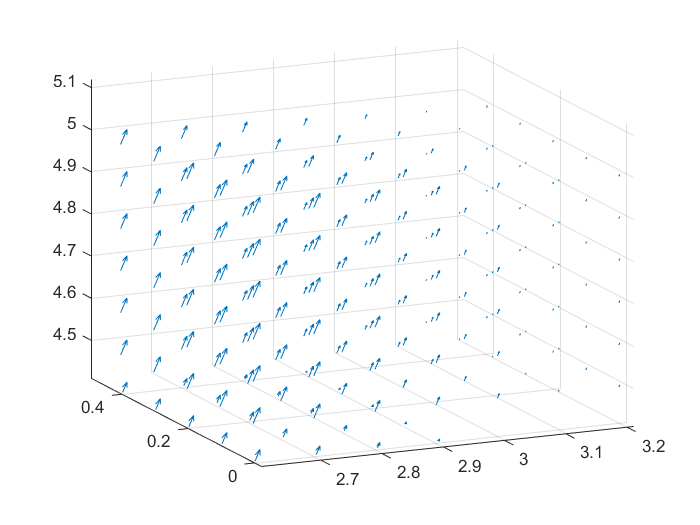
- Quiver plot: A quiver plot or vector plot is a type of plotting that gives directional components of u, v, w using the cartesian components x, y, and z. For plotting of quiver plot use quiver3().
Syntax:
quiver3(X, Y, Z, U, V, W)
Example:
Matlab `
% give the input value for x, % y and z [x,y,z]= meshgrid(0:0.1:5);
% using x, y and z give the % values for u,v and w u= sin(x).*cos(y); v= sin(x).*cos(y); w= sin(x).*cos(y);
%use quiver3() for 3d plotting quiver3(x,y,z,u,v,w);
`
Output: