Bar Graph in MATLAB (original) (raw)
Last Updated : 23 Jul, 2025
A Bar Graph is a diagrammatic representation of non-continuous or discrete variables. It is of 2 types vertical and horizontal. When the height axis is on the y-axis then it is a vertical Bar Graph and when the height axis is on the x-axis then it is a horizontal Bar Graph.
In MATLAB we have a function named _bar() which allows us to plot a bar graph.
**Syntax:
bar(X,Y) where X and Y represent the x and the y axis of the plane. The X and Y both are vectors.
Now let's move to some examples.
**Example 1: A simple Bar graph:
MATLAB `
% Coordinates of x-axis x=100:20:160; % Coordinates of y-axis y=[22 44 55 66];
% Bar function to plot the Bar graph % Set the width of each bar to 60 percent % of the total space available for each bar % Set the bar color green bar(x,y,0.6,"green");
`
**Output :

**Example 2: 3 groups of 4 bars:
MATLAB `
% 3 groups are made with 4 bars % ";" is used to separate the groups y=[2 5 4 1; 5 3 3 1; 2 8 4 6];
% bar function to plot the bar bar(y);
`
**Output :

**Example 3: Display Stacked bars:
MATLAB `
% 3 groups y=[2 5 4 1; 5 3 3 1; 2 8 4 6];
% stacked is used to stack the bars % on each other bar(y,'stacked');
`
**Output :

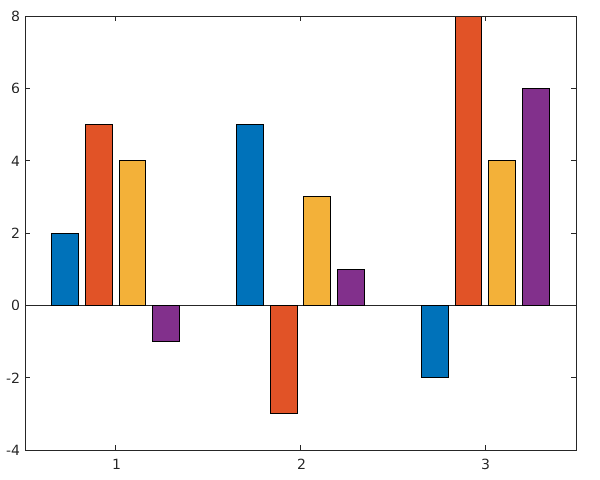
**Example 4: Display negative bars:
MATLAB `
% bars with negative values y=[2 5 4 -1; 5 -3 3 1; -2 8 4 6];
% bar function to display bars bar(y);
`
**Output :
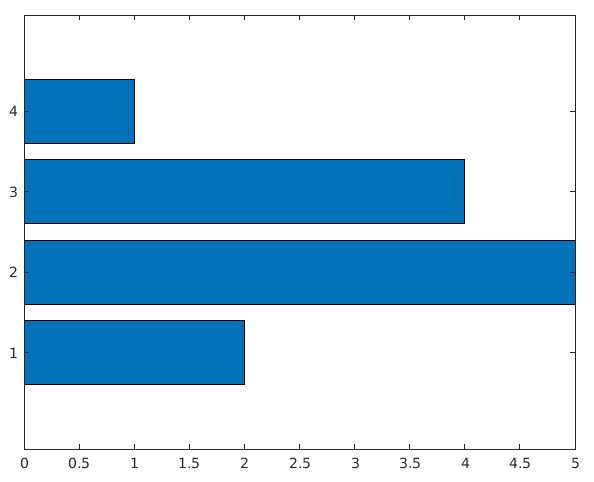
**Example 5: Display horizontal bar graph:
MATLAB `
% Coordinates of y axis y=[2 5 4 1];
% barh() function is used to % display bar horizontally barh(y);
`
**Output :