What is DFD (Data Flow Diagram) (original) (raw)
Last Updated : 9 Dec, 2025
A Data Flow Diagram (DFD) is a graphical tool used to represent how data moves through a system. It shows data inputs, outputs, data stores, and the processes that transform the data. DFDs provide a high-level overview of system functionality and are widely used in structured analysis due to their simplicity and clarity for both technical and non-technical users.
DFDs help visualize the major steps in a system and illustrate how information flows between different components.
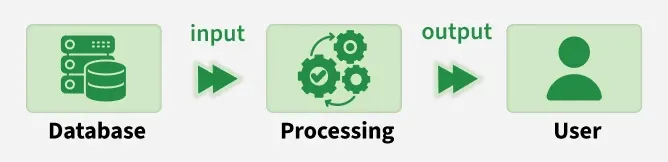
Basic Flow of DFD
Characteristics of Data Flow Diagram
- Graphical Representation: DFDs use standard symbols (processes, data stores, data flows, external entities) to simplify complex systems into easy-to-read diagrams.
- Problem Analysis: They help analyze system requirements by clarifying how data is processed, stored, and transferred.
- Abstraction: DFDs focus on what the system does, not how it is implemented. Technical details are intentionally omitted.
- Hierarchy: DFDs are built in levels: Level 0 (Context Diagram) → High-level overview and Level 1+ → More detailed breakdown of system processes
Levels of Data Flow Diagram
DFDs are categorized into various levels, with each level providing different degrees of detail. The levels are numbered from **0 and onward. The higher the level, the more detailed the diagram becomes.
- **Level 0 DFD (Context Diagram): Represents the entire system as one single process, showing its interaction with external entities. It highlights major inputs and outputs without internal details.
- **Level 1 DFD: Breaks the Level 0 process into major subprocesses. Shows internal data flows and data stores.
- **Level 2 and Beyond: Further decomposes Level 1 subprocesses for a detailed view of specific functional areas. Useful for large or complex systems requiring deeper analysis.
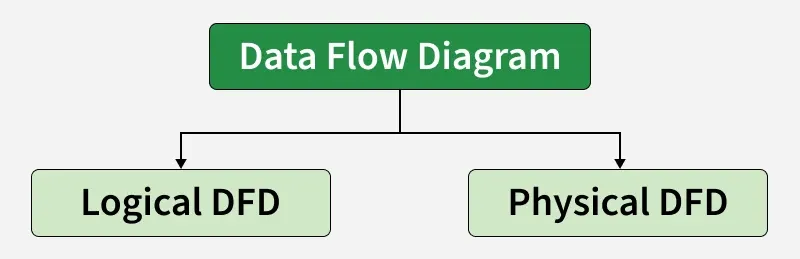
Types of Data Flow Diagram
DFDs can be classified into two main types, each focusing on a different perspective of system design:
Types of Data Flow Diagram
1. Logical DFD
The Logical Data Flow Diagram mainly focuses on the system process. It illustrates how data flows in the system. Logical Data Flow Diagram (DFD) mainly focuses on high level processes and data flow without diving deep into technical implementation details.
Logical DFDs is used in various organizations for the smooth running of system. Like in a Banking software system, it is used to describe how data is moved from one entity to another.
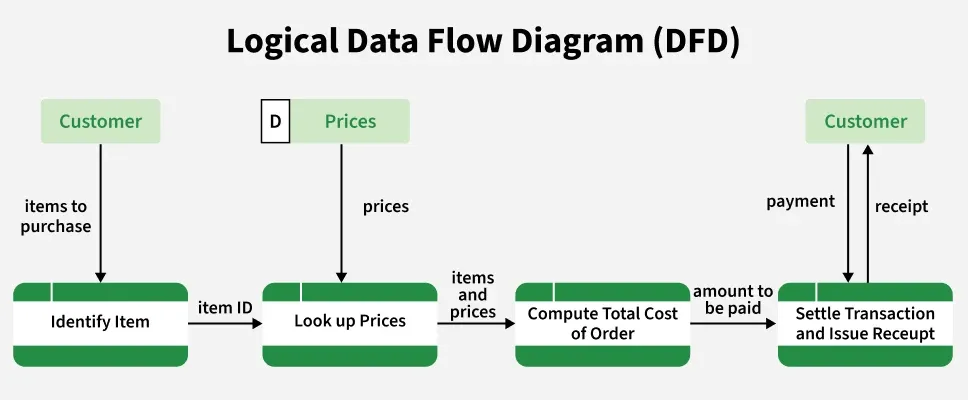
Logical Data Flow Diagram of Online Grocery Store
2. Physical DFD
Physical data flow diagram shows how the data flow is actually implemented in the system. In the Physical Data Flow Diagram (DFD), we include additional details such as data storage, data transmission, and specific technology or system components includin:
- Hardware
- Software
- Databases
- File structures
- Actual data movement and storage mechanisms
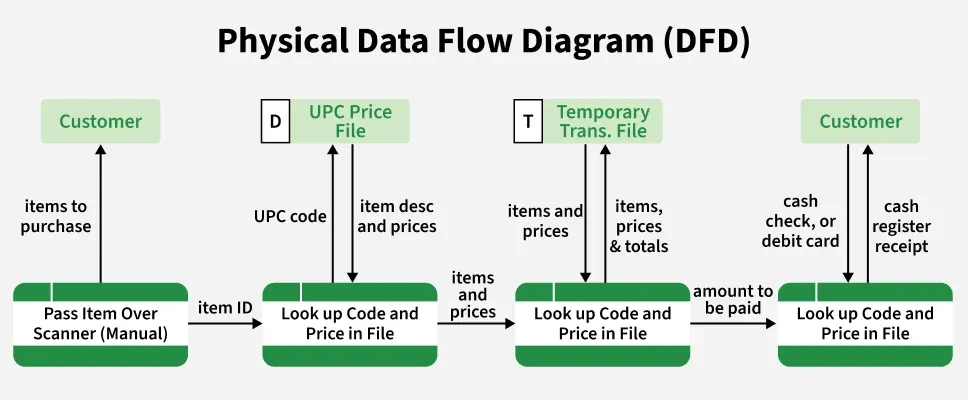
Physical Data Flow Diagram of online Grocery Store
Components of Data Flow Diagrams
A DFD consists of four main components that work together to represent the flow of data within the system:
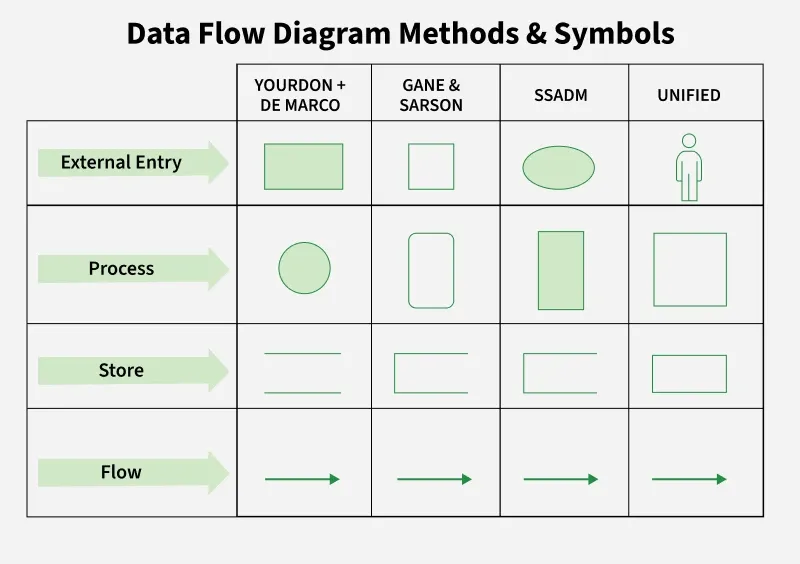
Data Flow Diagram Methods and Symbol
1. Process
Represents input to output transformation in a system that takes place because of process function.
- **Symbol: Circle or rounded rectangle
- **Example: "Validate User," "Generate Bill"
2. Data Flow
Shows the movement of information between processes, entities, or data stores. The arrow symbol is the symbol of data flow. A relatable name should be given to the flow to determine the information which is being moved.
- **Symbol: Arrow
- Each flow should represent one type of data.
3. Data Store (Warehouse)
Represents where data is stored for later use. Two horizontal lines represent the symbol of the store. The warehouse is simply not restricted to being a data file rather it can be anything like a folder with documents, an optical disc, a filing cabinet.
- **Symbol: Two horizontal lines
- Examples: Database, file system, document folder
4. External Entity (Terminator)
Users or systems outside the boundary that interact with the system. It can be, for example, organizations like banks, groups of people like customers or different departments of the same organization, which is not a part of the model system and is an external entity. Modeled systems also communicate with terminator.
Rules of DFD
Following are the rules of DFD:
1. Data can flow from
- Terminator or External Entity → Process
- Process → Terminator or External Entity
- Process → Data Store
- Data Store → Process
- Process → Process
2. Data Cannot Flow From
- Terminator or External Entity → Terminator or External Entity
- Terminator or External Entity → Data Store
- Data Store → Terminator or External Entity
- Data Store → Data Store
Example: Levels of DFD (Railway Reservation System)
To demonstrate how DFD levels are created, let's take an example of a Railway Reservation System. This example helps illustrate how data moves between users, processes, and data stores—such as passenger information, booking records, schedules, and payments - at different levels of detail. Each level of the DFD breaks the system into more specific processes to show how the reservation workflow operates internally.
Level 0 DFD
Shows the reservation system as one process interacting with:
- Passenger (external entity)
- Payment system
- Database (data store)
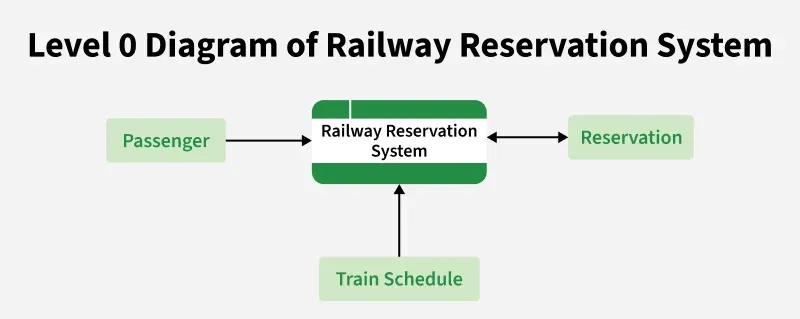
Level 0 of Railway Reservation System
Level 1 DFD
Breaks the system into subprocesses such as:
- Search Train
- Book Ticket
- Cancel Ticket
- Process Payment
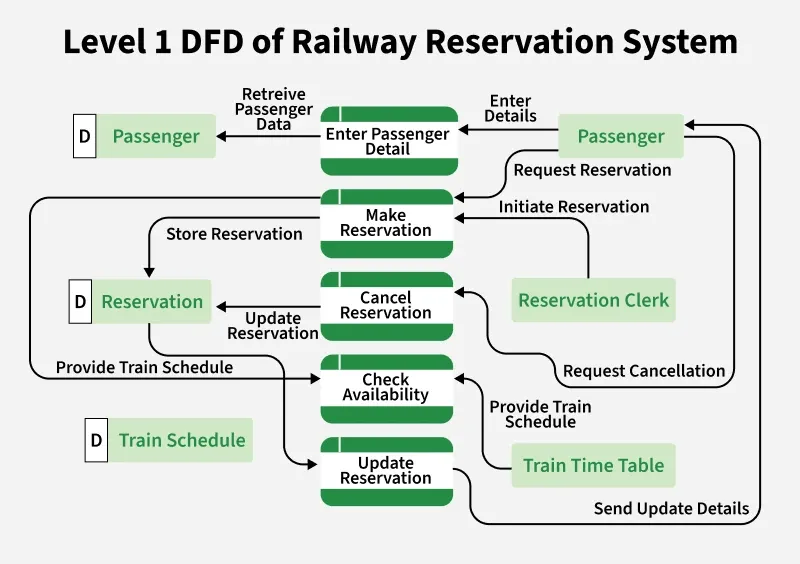
Level 1 DFD of Railway Reservation System
Level 2 DFD
Further decomposes subprocesses (e.g., "Book Ticket" → Verify Availability → Calculate Fare → Confirm Booking)
Advantages and Disadvantages of DFD
| **Advantages | **Disadvantages |
|---|---|
| Helps understand how data moves through the system. | Can be time-consuming to create for large systems. |
| Offers a clear graphical representation for both technical and non-technical users. | Focuses only on data flow — does not show control flow, performance, or UI details. |
| Breaks the system into smaller processes for better clarity and documentation. | Needs regular updates; diagrams easily become outdated if the system changes. |
| Useful for system analysis, requirement gathering, and documentation. | Requires proper knowledge to create accurate and meaningful diagrams. |