TriSurface Plot in Python using Matplotlib (original) (raw)
Tri-Surface Plot in Python using Matplotlib
Last Updated : 28 Apr, 2025
A Tri-Surface Plot is a type of surface plot, created by triangulation of compact surfaces of finite number of triangles which cover the whole surface in a manner that each and every point on the surface is in triangle. The intersection of any two triangles results in void or a common edge or vertex. This type of plot is created where the evenly sampled grids are restrictive and inconvenient to plot. Generally Tri-Surface plots are created by calling ax.plot_trisurf() function of matplotlib library. Some of the attributes of the function are listed below:
| Attribute | Parameter |
|---|---|
| X, Y, Z | dataset as 1D array to be plotted |
| colors | color of the surface patches |
| cmap | color map to set the color of surface patches |
| norm | parameter to normalize map values of colors |
| vmin | minimum value of map |
| vamx | maximum value of map |
| shade | attribute to shade the facecolors |
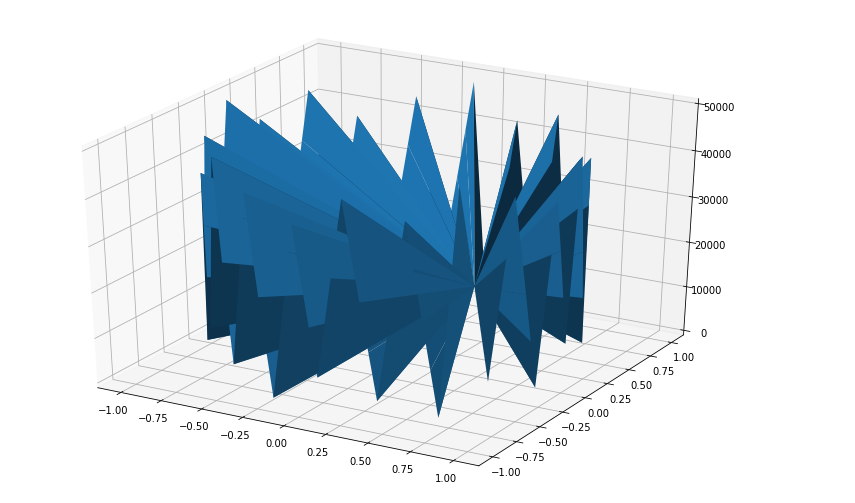
Example 1: Let's create a basic Tri-Surface plot using the ax.plot_trisurf() function.
Python3 `
Import libraries
from mpl_toolkits import mplot3d import numpy as np import matplotlib.pyplot as plt
Creating dataset
z = np.linspace(0, 50000, 100) x = np.sin(z) y = np.cos(z)
Creating figure
fig = plt.figure(figsize =(14, 9)) ax = plt.axes(projection ='3d')
Creating plot
ax.plot_trisurf(x, y, z, linewidth = 0.2, antialiased = True);
show plot
plt.show()
`
Output :

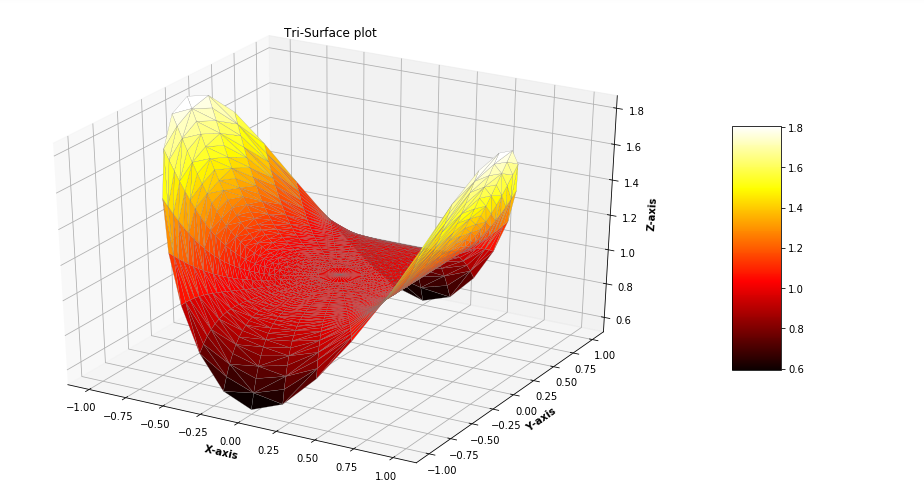
Example 2 : For better understanding Let's take another example.
Python3 `
Import libraries
from mpl_toolkits.mplot3d import Axes3D
import matplotlib.pyplot as plt
import numpy as np
Creating radii and angles
r = np.linspace(0.125, 1.0, 100)
a = np.linspace(0, 2 * np.pi,
100,
endpoint = False)
Repeating all angles for every radius
a = np.repeat(a[..., np.newaxis], 100, axis = 1)
Creating dataset
x = np.append(0, (r * np.cos(a)))
y = np.append(0, (r * np.sin(a)))
z = (np.sin(x ** 4) + np.cos(y ** 4))
Creating figure
fig = plt.figure(figsize =(16, 9))
ax = plt.axes(projection ='3d')
Creating color map
my_cmap = plt.get_cmap('hot')
Creating plot
trisurf = ax.plot_trisurf(x, y, z,
cmap = my_cmap,
linewidth = 0.2,
antialiased = True,
edgecolor = 'grey')
fig.colorbar(trisurf, ax = ax, shrink = 0.5, aspect = 5)
ax.set_title('Tri-Surface plot')
Adding labels
ax.set_xlabel('X-axis', fontweight ='bold') ax.set_ylabel('Y-axis', fontweight ='bold') ax.set_zlabel('Z-axis', fontweight ='bold')
show plot
plt.show()
`
Output:
