Working with Missing Data in Pandas (original) (raw)
Last Updated : 02 Jun, 2025
In Pandas, missing data occurs when some values are missing or not collected properly and these missing values are represented as:
- **None: A Python object used to represent missing values in object-type arrays.
- **NaN: A special floating-point value from NumPy which is recognized by all systems that use IEEE floating-point standards.
In this article we see how to detect, handle and fill missing values in a DataFrame to keep the data clean and ready for analysis.
Checking Missing Values in Pandas
Pandas provides two important functions which help in detecting whether a value is NaN helpful in making data cleaning and preprocessing easier in a DataFrame or Series are given below :
**1. Using isnull()
**isnull() returns a DataFrame of Boolean value where True represents missing data (NaN). This is simple if we want to find and fill missing data in a dataset.
**Example 1: Finding Missing Values in a DataFrame
We will be using Numpy and Pandas libraries for this implementation****.**
Python `
import pandas as pd import numpy as np
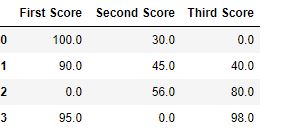
d = {'First Score': [100, 90, np.nan, 95], 'Second Score': [30, 45, 56, np.nan], 'Third Score': [np.nan, 40, 80, 98]} df = pd.DataFrame(d)
mv = df.isnull()
print(mv)
`
**Output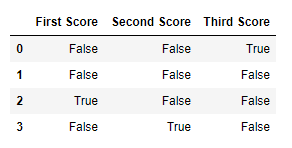
**Example 2: Filtering Data Based on Missing Values
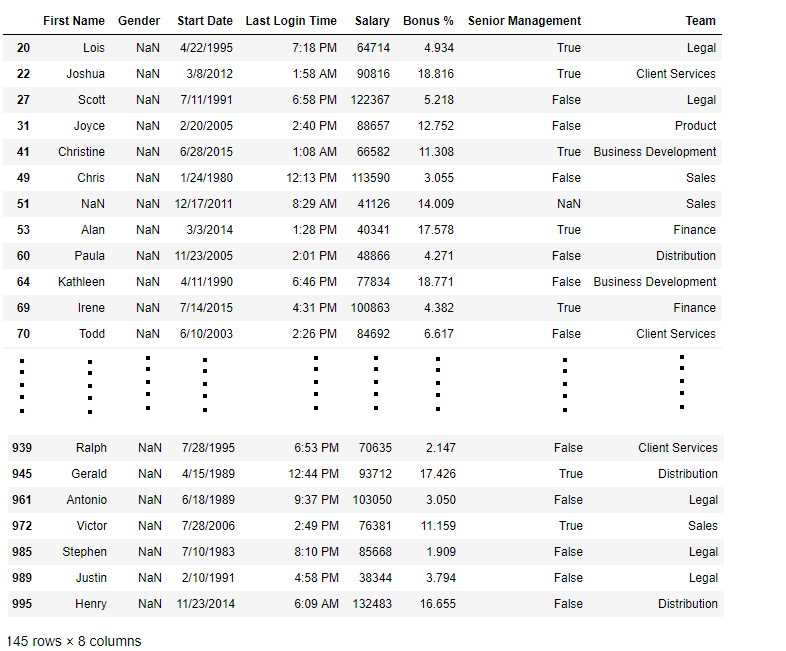
Here we used random Employee dataset, you can download the csv file from here. The isnull() function is used over the "Gender" column in order to filter and print out rows containing missing gender data.
Python `
import pandas as pd d = pd.read_csv("/content/employees.csv")
bool_series = pd.isnull(d["Gender"]) missing_gender_data = d[bool_series] print(missing_gender_data)
`
**Output
**2. Checking for Non-Missing Values Using notnull()
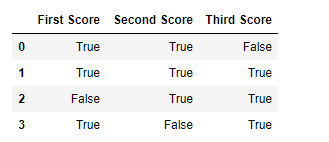
**notnull() function returns a DataFrame with Boolean values where True indicates non-missing (valid) data. This function is useful when we want to focus only on the rows that have valid, non-missing values.
**Example 1: Identifying Non-Missing Values in a DataFrame
Python `
import pandas as pd import numpy as np
d = {'First Score': [100, 90, np.nan, 95], 'Second Score': [30, 45, 56, np.nan], 'Third Score': [np.nan, 40, 80, 98]} df = pd.DataFrame(d)
nmv = df.notnull()
print(nmv)
`
**Output
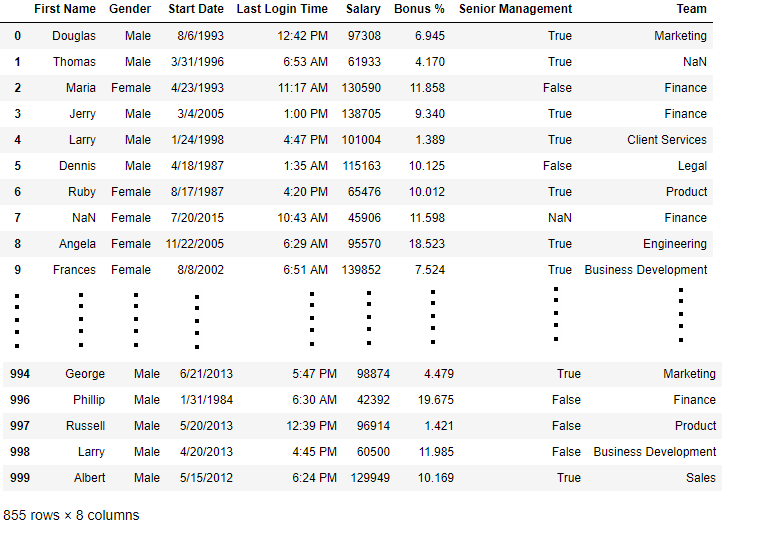
**Example 2: Filtering Data with Non-Missing Values
notnull()function is used over the "Gender" column in order to filter and print out rows containing missing gender data.
Python `
import pandas as pd d = pd.read_csv("/content/employees.csv")
nmg = pd.notnull(d["Gender"])
nmgd= d[nmg]
display(nmgd)
`
**Output
Filling Missing Values in Pandas
Following functions allow us to replace missing values with a specified value or use interpolation methods to find the missing data.
1. Using fillna()
**fillna() used to replace missing values (NaN) with a given value. Lets see various example for this.
**Example 1: Fill Missing Values with Zero
Python `
import pandas as pd import numpy as np
d = {'First Score': [100, 90, np.nan, 95], 'Second Score': [30, 45, 56, np.nan], 'Third Score': [np.nan, 40, 80, 98]} df = pd.DataFrame(d)
df.fillna(0)
`
**Output
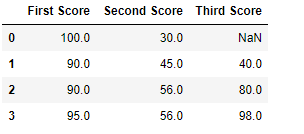
**Example 2: Fill with Previous Value (Forward Fill)
The pad method is used to fill missing values with the previous value.
Python `
df.fillna(method='pad')
`
**Output
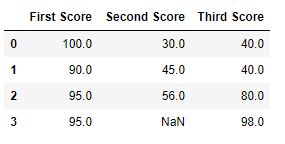
**Example 3: Fill with Next Value (Backward Fill)
The bfill function is usedto fill it with the next value.
Python `
df.fillna(method='bfill')
`
**Output
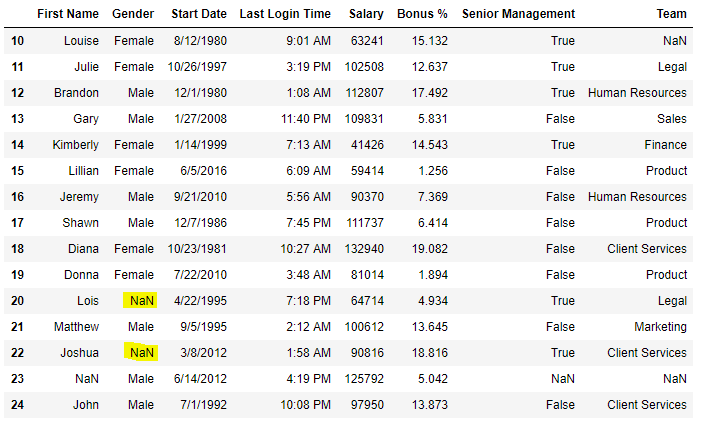
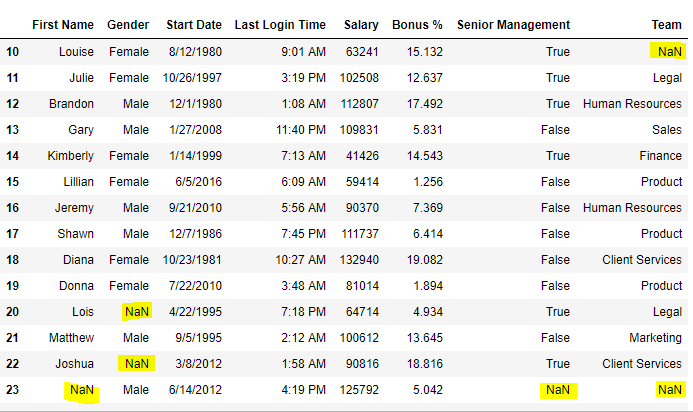
**Example 4: Fill NaN Values with 'No Gender'
Python `
import pandas as pd import numpy as np d = pd.read_csv("/content/employees.csv")
d[10:25]
`
**Output
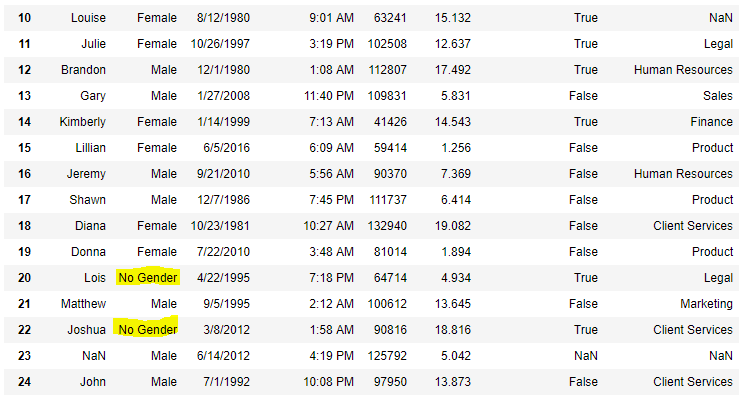
Now we are going to fill all the null values in Gender column with "No Gender"
Python `
d["Gender"].fillna('No Gender', inplace = True) d[10:25]
`
**Output
2. Using replace()
Use**replace()function to replace NaN values with a specific value.
**Example
Python `
import pandas as pd import numpy as np
data = pd.read_csv("/content/employees.csv") data[10:25]
`
**Output
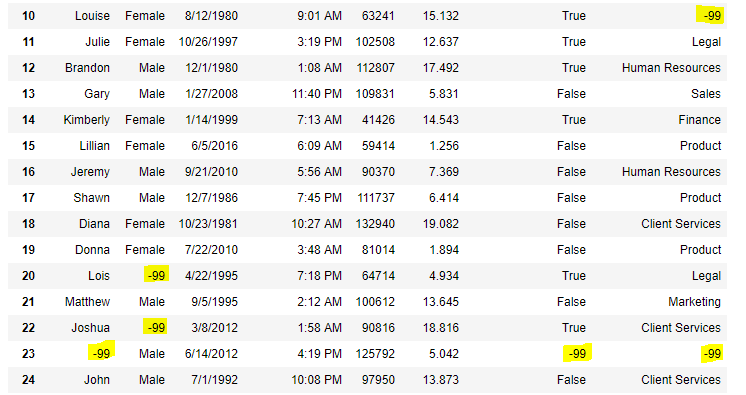
Now, we are going to replace the all NaN value in the data frame with -99 value.
Python `
data.replace(to_replace=np.nan, value=-99)
`
**Output
3. Using interpolate()
The**interpolate()function fills missing values using interpolation techniques such as the linear method.
**Example
Python `
import pandas as pd
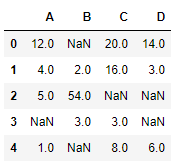
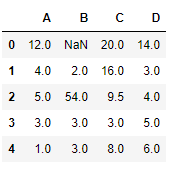
df = pd.DataFrame({"A": [12, 4, 5, None, 1],
"B": [None, 2, 54, 3, None],
"C": [20, 16, None, 3, 8],
"D": [14, 3, None, None, 6]})
print(df)
`
**Output
Let’s interpolate the missing values using Linear method. This method ignore the index and consider the values as equally spaced.
Python `
df.interpolate(method ='linear', limit_direction ='forward')
`
**Output
Dropping Missing Values in Pandas
The **dropna() function used to removes rows or columns with NaN values. It can be used to drop data based on different conditions.
1. Dropping Rows with At Least One Null Value
Remove rows that contain at least one missing value.
**Example
Python `
import pandas as pd import numpy as np
dict = {'First Score': [100, 90, np.nan, 95], 'Second Score': [30, np.nan, 45, 56], 'Third Score': [52, 40, 80, 98], 'Fourth Score': [np.nan, np.nan, np.nan, 65]} df = pd.DataFrame(dict)
df.dropna()
`
**Output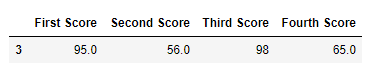
**2. Dropping Rows with All Null Values
We can drop rows where all values are missing using dropna(how='all').
**Example
Python `
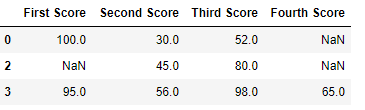
dict = {'First Score': [100, np.nan, np.nan, 95], 'Second Score': [30, np.nan, 45, 56], 'Third Score': [52, np.nan, 80, 98], 'Fourth Score': [np.nan, np.nan, np.nan, 65]} df = pd.DataFrame(dict)
df.dropna(how='all')
`
**Output
3. Dropping Columns with At Least One Null Value
To remove columns that contain at least one missing value we use dropna(axis=1).
**Example
Python `
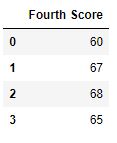
dict = {'First Score': [100, np.nan, np.nan, 95], 'Second Score': [30, np.nan, 45, 56], 'Third Score': [52, np.nan, 80, 98], 'Fourth Score': [60, 67, 68, 65]} df = pd.DataFrame(dict)
df.dropna(axis=1)
`
**Output
4. Dropping Rows with Missing Values in CSV Files
When working with CSV files, we can drop rows with missing values using dropna().
**Example
Python `
import pandas as pd d = pd.read_csv("/content/employees.csv")
nd = d.dropna(axis=0, how='any')
print("Old data frame length:", len(d)) print("New data frame length:", len(nd)) print("Rows with at least one missing value:", (len(d) - len(nd)))
`
**Output:

Drop Rows with NaN
Since the difference is 236, there were 236 rows which had at least 1 Null value in any column. By using these functions we can easily detect, handle and fill missing values.